Curated OER
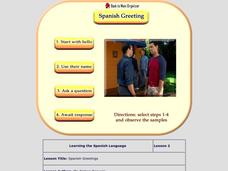
Lesson 2- Spanish Greeting
Break down a quick conversation in Spanish. After the teacher presents the vocabulary, the class heads to the computer lab, where class members can watch a brief interactive video. The visual is one clip separated into four clearly...
Statistics Education Web
Now You SeeIt, Now You Don't: Using SeeIt to Compare Stacked Dotplots to Boxplots
How does your data stack up? A hands-on activity asks pupils to collect a set of data by measuring their right-hand reach. Your classes then analyze their data using a free online software program and make conclusions as to the...
Statistics Education Web
I Always Feel Like Somebody's Watching Me
Future statisticians and potential psychics first conduct an experiment to collect data on whether a person can tell if someone is staring at them. Statistical methods, such as hypothesis testing, chi-square tests, binomial tests, and...
Statistics Education Web
Are Female Hurricanes Deadlier than Male Hurricanes?
The battle of the sexes? Scholars first examine data on hurricane-related deaths and create graphical displays. They then use the data and displays to consider whether hurricanes with female names result in more deaths than hurricanes...
Statistics Education Web
How Wet is the Earth?
Water, water, everywhere? Each pupil first uses an Internet program to select 50 random points on Earth to determine the proportion of its surface covered with water. The class then combines data to determine a more accurate estimate.
Statistics Education Web
What Percent of the Continental US is Within One Mile of a Road?
There are places in the US where a road cannot be found for miles! The lesson plan asks learners to use random longitude and latitude coordinates within the US to collect data. They then determine the sample proportion and confidence...
Statistics Education Web
Text Messaging is Time Consuming! What Gives?
The more you text, the less you study. Have classes test this hypothesis or another question related to text messages. Using real data, learners use technology to create a scatter plot and calculate a regression line. They create a dot...
Statistics Education Web
Types of Average Sampling: "Household Words" to Dwell On
Show your classes how different means can represent the same data. Individuals collect household size data and calculate the mean. Pupils learn how handling of the data influences the value of the mean.
Statistics Education Web
NFL Quarterback Salaries
Use statistics to decide if NFL quarterbacks earn their salaries! Learners study correlation coefficients after using technology to calculate regression equations. Through the data, they learn the meaning of correlation and correlation...
Statistics Education Web
Saga of Survival (Using Data about Donner Party to Illustrate Descriptive Statistics)
What did gender have to do with the survival rates of the Donner Party? Using comparative box plots, classes compare the ages of the survivors and nonsurvivors. Using the same method, individuals make conclusions about the...
Statistics Education Web
Who Sends the Most Text Messages?
The way you use statistics can tell different stories about the same set of data. Here, learners use sets of data to determine which person sends the most text messages. They use random sampling to collect their data and calculate a...
Statistics Education Web
Population Parameter with M-and-M's
Manufacturers' claims may or may not be accurate, so proceed with caution. Here pupils use statistics to investigate the M&M's company's claim about the percentage of each color of candy in their packaging. Through the activity,...
American Statistical Association
EllipSeeIt: Visualizing Strength and Direction of Correlation
Seeing is believing. Given several bivariate data sets, learners make scatter plots using the online SeeIt program to visualize the correlation. To get a more complete picture of the topic, they research their own data set and perform an...
American Statistical Association
Bubble Trouble!
Which fluids make the best bubbles? Pupils experiment with multiple fluids to determine which allows for the largest bubbles before popping. They gather data, analyze it in multiple ways, and answer analysis questions proving they...
American Statistical Association
What Fits?
The bounce of a golf ball changes the result in golf, mini golf—and a great math activity. Scholars graph the height of golf ball bounces before finding a line of best fit. They analyze their own data and the results of others to better...
Curated OER
What's Down There
Third graders gather and examine samples from the school outdoor environment. They compare/contrast their samples with those of other students. Students record the results of their observations.
Curated OER
Life and Times, Developing a Chronology
Students review the career and life of Ernie Pyle as an example of a biography in context. They consider how a chronology maps out the events in the life of an individual in the context of other events that were occurring at the same time.
Curated OER
Plan an Advertising Campaign to Attract New Citizens
Students examine how to use visual media as a creative way of thinking about and responding to immigration issues. They conduct Internet research, and design and create a poster or brochure to attract new immigrant to Indiana.
Curated OER
The European Union
Seventh graders perform research related to the concept of the European Union. By becoming familiar with the Union they comprehend the advantages and disadvantages of the governmental structure.
Curated OER
Religious Symbols
Students research an overview of several world religions. They include explanations of common generalities, misunderstandings, and prejudices attached to those religions. Students gain knowledge of world religions through multiple...
Curated OER
Quidditch Sports Report
The students pretend they are the school newspaper's sports reporter, they write an article on quidditch. Students create a newspaper layout for the story that includes headings, newspaper branding and logos, advertising and accompanying...
Curated OER
Ho Chi Minh and Freedom of Speech
High schoolers explore freedom of speech. Individually, they complete a K-W-L chart. Students participate in a "Stand If You Can" activity where they make statements regarding the freedom of speech. High schoolers stand if they agree...
Curated OER
Alcohol Addiction and Its Effect on the Body
Ninth graders use the Internet to research the liver and the effects of alcoholism. In this alcohol addiction lesson students divide into groups and get information on their topic.
Curated OER
Research, Writing, and the 'Isms'
Students research an art style. They create an original short story, poem, or personal essay and illustrate the written work with the style of art they researched.


