Howard Hughes Medical Institute
Gorongosa: Scientific Inquiry and Data Analysis
How does the scientific process begin? Introduce ecology scholars to scientific inquiry through an insightful, data-driven lesson. Partners examine data from an ongoing research study to determine the questions it answers. The resource...
Cornell University
Study Soil
What's in soil? Young scientists study the pH levels of soil from their school yard. They observe the land and area the soil came from to decide if location has anything to do with acidity level.
NOAA
Ground-truthing Satellite Imagery with Drifting Buoy Data
Ground-truthing ... is it even a word? The last installment of a five-part series analyzes how scientists collect sea surface temperature data. Scholars use government websites to compare temperature data collected directly from buoys...
Physics Classroom
Position-Time Graphs - Conceptual Analysis
Increasingly, colleges and employers want applicants with strong conceptual analysis skills, so give them some practice! Applying these skills to position-time graphs encourages synthesis of knowledge. To complete an installment of a...
Curated OER
Scaling it Down: Caves Have Maps, Too
Measurement and map skills are the focus of this lesson, where students crawl through a "cave" made out of boxes, desks and chairs, observing the dimensions. Your young geographers measure various aspects of the cave and practice...
Howard Hughes Medical Institute
Lactase Persistence: Evidence for Selection
What's the link between lactase persistence and dairy farming? Biology scholars analyze data to find evidence of the connection, then relate this to human adaptation. Working individually and in small groups, learners view short video...
Howard Hughes Medical Institute
Human Impacts on Biodiversity
Have you always wanted to take your science class on an amazing field trip they will never forget? Now you can! Observe the wildlife in an African savanna through trail cameras with a five-part data analysis activity. Learners analyze...
Chymist
Tritration: Standardization of a Base and Analysis of Stomach Antacid Tablets
Do antacid tablets really do what they claim? An experimental lesson attempts to answer this question. Individuals practice the process of titration during the first part of the experiment. They then use those skills to neutralize an...
Curated OER
Designing a Study
Students explore features to consider when designing a scientific study. In this science research lesson plan, students examine different methods of data collection and consider which method would be appropriate for determining how many...
Curated OER
Science Skills and Experimental Design
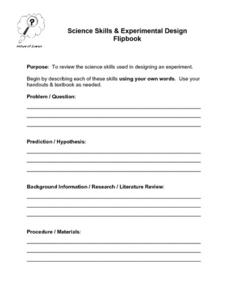
In this experimental design worksheet, students describe the different science skills required when designing an experiment. Then students create a flipbook with the information. This worksheet has 9 short answer questions.
Curated OER
Dimensional Analysis Practice Problems
In this science and engineering worksheet, students use dimensional analysis to solve each of the problems stated on the sheet. They illustrate their work and how they arrived at their answers by using significant figures for their final...
Academy of American Poets
Teach This Poem: “Dead Stars” by Ada Limón
Pay attention! A lesson featuring Ada Limon's poem "Dead Stars" is designed to help learners develop their noticing skills. Class members first study the constellation Orion's image and list what they notice and how the image makes them...
Curated OER
Titration: Standardization of a Base and Analysis of Stomach Antacid Tablets
Titration experiments don't have to give your high schoolers a stomachache. Study the ways to titrate an acide with a base in an engaging science experiment, which involves creating solutions and performing titrations. Pupils...
Curated OER
Graphing and Analyzing Biome Data
Students explore biome data. In this world geography and weather data analysis lesson, students record data about weather conditions in North Carolina, Las Vegas, and Brazil. Students convert Fahrenheit degrees to Celsius degrees and use...
National Wildlife Federation
Conceptualizing Module II - Putting It All Together
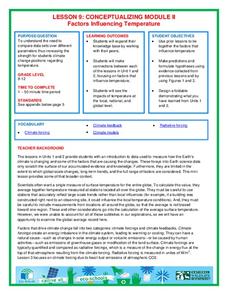
"Creativity is just connecting things." - Steve Jobs. After weeks of researching climate change, the ninth lesson plan in a series of 21 combines the data and analysis to address essential questions. It covers natural phenomenon,...
Chicago Botanic Garden
Micro-GEEBITT Climate Activity
A truly hands-on and inquiry based learning activity bridges all the lessons in the series together. Beginning with a discussion on average global temperatures, young meteorologists use real-world data to analyze climate trends in order...
Curated OER
A Comparison Study of Water Vapor Data to Precipitation over North America
Students use NASA satellite data to compare water vapor over the United States. In this data analysis lesson students use an Excel spreadsheet to map their data.
NASA
Observing Monsoon Weather Patterns with TRMM Data
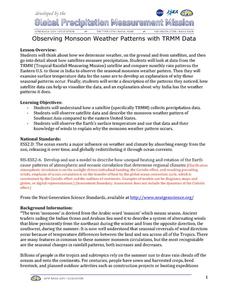
Follow a fabulous slide show on how monsoons form and how satellite technology is being used to observe the phenomena, explaining why they occur. Afterward, visit the TRMM (Tropical Rainfall Measuring Mission) website to access actual...
Curated OER
Ethics Activity: Issue Analysis
Students analyze environmental health issues with respect to the players, their positions, and associated values, after being introduced to the concepts of events, problems, and issues. They apply the skills of issue analysis to...
Curated OER
ABC and 1-2-3 Farming
Students demonstrate how to alphabetize animal names. In this word study lesson, students identify animals that live on the farm and conduct a favorite farm animal survey. Students order animal pictures in alphabetical order.
Association of American Geographers
Project GeoSTART
Investigate the fascinating, yet terrifying phenomenon of hurricanes from the safety of your classroom using this earth science unit. Focusing on developing young scientists' spacial thinking skills, these lessons engage...
Rainforest Alliance
Forests of Guatemala
With 90 percent of its land area covered in forests, Suriname, a country in South America, contains the largest percentage of forests throughout the world. Here is an activity that brings classmates together to learn about the...
Beyond Benign
Got Gas
How much gas does it take to drive around town? The class uses a variety of mathematical procedures to take a look at the use of gas for transportation. Class members use a different unit to determine the cost of driving a car as opposed...
Curated OER
Discovering Mitosis in Onion Roots
Students discover the different stages of mitosis by examining onion roots under a microscope, drawing diagrams of what they see, and organizing collected data in a chart and create a pie graph from their lab data.


