Curated OER
Engaging Young Scientists with Inquiry: Part Two
Evaluating data and learning to communicate the results is a big piece of the inquiry puzzle.
Curated OER
All Choked Up By Smoking Statistics
Scholars use the article "More College Learners Are Smoking, Study Says" as a springboard for discussion on the reasons why people smoke cigarettes. They investigate different methods of graphing statistics by using the data provided in...
Fluence Learning
Writing an Opinion: Buddies that Bark or Purr-fect Pets?
Which animal is best for you—a dog or cat? Why? Engage third graders in an opinion writing assessment that prompts them to read facts about both pets, and then write and decide which pet is best for them.
Virginia Department of Education
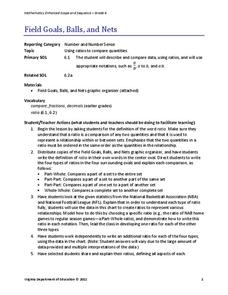
Field Goals, Balls, and Nets
Score a resource on ratios. Young mathematicians learn about different ways to express ratios. Using sports data, they write statements about the statistics in ratio form.
University of Georgia
Freezing and Melting of Water
Examine the behavior of energy as water freezes and melts. An engaging activity provides a hands-on experience to learners. Collaborative groups collect data and analyze the graphs of the temperature of water as it freezes and then...
Beyond Benign
Can You Hear Me Now? Cell Phone Accounts
How sustainable are cell phones? Throughout the unit, learners explore the issues around cell phones concerning sustainability. Class members take a graphical look at the number of cell phones across the world using a box-and-whisker...
Curated OER
Residential Power System
Perform data analysis on energy consumption to apply algebraic expressions to the real world. Learners will write and solve equations that answer various questions from residential power use. They will collect data at home and calculate...
Curated OER
Exploring Seasonal Shadows and Sunlight
What can shadows tell us about the changing season? Over several months, astronomy learners record length and position of an outdoor object's shadow, such as a flagpole. They apply the data to a growing hypothesis and note the...
Annenberg Foundation
Skeeters Are Overrunning the World
Skeeters are used to model linear and exponential population growth in a wonderfully organized lesson plan including teachers' and students' notes, an assignment, graphs, tables, and equations. Filled with constant deep-reaching...
Radford University
Is Fall Normal?
Fine the normality of fall measurements. Pairs collect measurements of fall leaves and one other fall object. Using the measurements, the groups determine the descriptive statistics for the object and using the Empirical Rule, figure out...
Curated OER
Persuasive Writing-"Those Whales"
Use an article about an Orca killing a trainer to help writers complete a persuasive essay. The article, other templates, and models are attached. Scholars divide up into groups of three where each person takes a different role,...
American Statistical Association
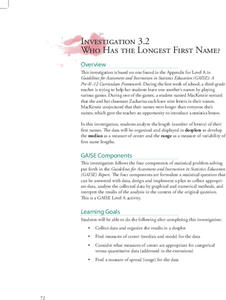
Who Has the Longest First Name?
Name that statistic! Classmates each write their name and the number of letters in it on a sticky note to place on the board. As a class, they determine the median, mode, and range of the name lengths, and create a dot plot of the data....
Fluence Learning
Writing About Informational Text: Beyond the Beyond—Galaxies
Everyone has a different point of view, even when it comes to the enormity of the universe. Two separate text passages explain the scope of a galaxy, prompting young readers to write an essay about each author's argument and how the...
Fluence Learning
Writing Informative Text: Did Shakespeare Write Shakespeare?
William Shakespeare penned some of the richest and most fascinating works of literature—or did he? Middle schoolers read three brief informative passages and conduct additional research to evaluate the claim that Shakespeare did not...
Fluence Learning
Writing an Opinion Requiring Voting
Challenge writers to compose an essay detailing their stance on, and the history of, voting. Three assignments, each broken down into three parts, requires fifth graders to take notes, read and complete charts, write paragraphs, compare...
Fluence Learning
Writing About Literary Text: Wise or Foolish?
A three-part assessment promotes reading comprehension skills. Class members read literary texts and take notes to discuss their findings, answer comprehension questions, write summaries, and complete charts.
Curated OER
Comparing School Bus Stats
Engage in a lesson plan that is about the use of statistics to examine the number of school buses used in particular states. They perform the research and record the data on the appropriate type of graph. Then they solve related word...
American Institutes for Research
Digital Smiles
Explore metric measurement, recording data, and creating an electronic spreadsheet displaying results with your math class. Scholars will measure the length of their smiles, record the measurements, and represent the results on an...
Curated OER
Exploring Careers
The world is full of possibilities for your ELLs. Help them explore their career options with a lesson that incorporates Internet research and expository writing. Not only will they learn more about their careers of choice, but both...
School Journalism
Investigative and Data Journalism – Day One
A free press, free to investigate and report on responsibly, compelling stories, is essential to a democracy. A 10-slide presentation details where to get ideas, how to go about an investigation, gather data, and assure the accuracy of...
Curated OER
Graphing Data
Second graders graph data about their classmates. In this data analysis lesson, 2nd graders ask each other several questions about their hair color and eye color. Students graph the data that they collected.
Curated OER
Hess' Law Data Sheet
In this Hess' Law worksheet, students write their data and calculations from the lab they performed on Hess's Law. They calculate the heat of reactions per mole of substances used and calculate the theoretical heat of reaction and...
Curated OER
The Gathering and Analysis of Data
Young mathematicians gather data on a topic, graph it in various forms, interpret the information, and write a summary of the data. They present their data and graphs to the class.
Curated OER
Data Analysis of Ground Level Ozone
Sixth graders construct and interpret graphs from ozone data collected in Phoenix area. Can be adapted to other areas.


