Curated OER
Equations and Inequalities
Students in a college algebra class use graphs to solve inequalities. Using the coordinate graphing system, they represent the relationship between x and y intercepts. They practice solving equations with complex numbers and locate...
Alabama Learning Exchange
We Love to Graph!
Students experience graphing points. In this graphing points lesson, students play an on-line game where they must name 10 coordinate pairs correctly. Students play a maze game where they maneuver a robot using coordinate pairs. ...
Curated OER
Algebra: Linear Equations
Students draw graphs of linear equations using the slope intercept form. Upon completion of various problems, students record their answers on the board and explain the solutions to classmates. Students take a test over the material...
Curated OER
Human Coordinate Plane
Eighth graders form a human coordinate grid to develop knowledge of the placement and meaning of coordinates on a grid. They experience the placements of the x and y coordinates in an ordered pair.
Curated OER
Rational Functions
In this algebra worksheet, students solve rational functions and identify the x and y intercepts, the vertical and horizontal asymptotes. There are 26 questions.
Curated OER
Graphing Polynomials of Higher Degree
Using Wolframalpha graphing capabilites, algebra learners graph polynomials with degrees of three and larger. They identify the roots and graph each polynomial, predict zeros and shapes of graphs, and validate their understanding through...
Curated OER
Rocketsmania And Slope
Students use a professional basketball team's data and graph it on a coordinate plane. They draw a line of regression and finding its equation. They access a website containing statistics for the Houston Rockets basketball team to solve...
Willow Tree
Linear Relationships
There's just something special about lines in algebra. Introduce your classes to linear equations by analyzing the linear relationship. Young mathematicians use input/output pairs to determine the slope and the slope-intercept formula to...
Illustrative Mathematics
Proportional Relationships, Lines, and Linear Equations
The resource is a good introduction to what makes a proportional relationship between two lines. Discuss the similarities of both lines and the possibility of intersection. Use this opportunity to list other acceptable forms of each...
West Contra Costa Unified School District
Key Features of Graphs
The key is ... After a day of instruction on key features of graphs, groups create a poster and presentation on the key features of their given function graph. The resource provides an extension activity of "telephone" using graphs.
Curated OER
Solving Systems of Equations
Students identify the quadrants and axis of a coordinate plane. In this algebra instructional activity, students discover the ocrrect way to graph using the coordinate plane. They discuss the relationship between x and y values, domain...
NASA
Suit Yourself: Fitted for Space
If he keeps this up, will he have enough air? After watching a video about spacewalks, groups of four brainstorm aspects of spacesuit design and present it to the rest of the class. Groups create mathematical models of oxygen use for two...
Willow Tree
Equations of a Line
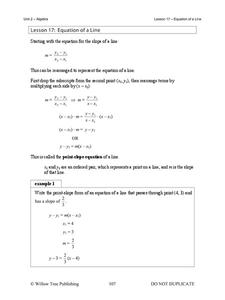
Each form of a linear equation has its purpose — pupils just have to find it. Building on the previous lesson in the series, learners examine point-slope and standard form. Using point-slope form, pupils write the equation of a...
NASA
Spacewalking
Hold your breath. The video and interactive website introduce the class to spacewalking and spacesuits. Using oxygen data from two astronauts, individuals determine a mathematical model to fit the data. Using that mathematical model, the...
Curated OER
Stretching the Quads
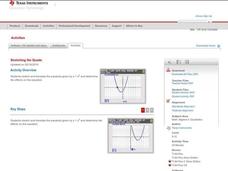
Explore parabolas in this algebra lesson with the graphing calculator. The class investigates what effects the changing of the parameters of the vertex form of a quadrati have to its graph. They find the zeros of a quadratic graphically...
Curated OER
Linear Functions
Your learners will explore linear functions by analyzing a graph of the linear equations.Then learners analyze through calculating f(x+P) and g(x+p)
Curated OER
Worksheet 24
In this math worksheet, students work with three dimensional graphing. The application problems include surface ships on maneuvers determining a submarine's course, helicopter travel, and proving that four points are coplanar. Students...
Curated OER
Writing Equations from a Table
Students use coordinates in a table to write equations. For this algebra lesson, students discuss rate of change as it relates to slope and x and y values. They plot the points from a table to graph their lines and write an equation for...
Curated OER
The Phone Bill Problem
Students write an equation for a linear function. For this algebra lesson, students collect data, plot it and graph it. They identify the equation of the graphed data and define the slope and y-intercept of the graph.
Curated OER
Race The Rapper: Slopes
Students calculate the slope of the equation For this algebra lesson, students graph coordinate pairs of linear equations and identify the relationship between x and y values and slope. They differentiate between functions and...
Virginia Department of Education
Transformationally Speaking
Young mathematicians explore transformations of graphs by graphing sets of functions on the same pair of axes. They use their graphs to determine the effect that the values of a and b in y = ax + b have on the graph of y = x.
West Contra Costa Unified School District
Comparing Linear and Quadratic Functions
If a linear function and a quadratic function enter a boxing match, which one would win? Learners first review how to find key features of linear and quadratic functions. Next, they compare key features of pairs of functions.
Curated OER
More with Graphing and Intercepts
In this math worksheet, students graph the equations through recognizing the position of the intercepts. They also create a function table for each.
Curated OER
Slope and Equations of Lines
In this equation worksheet, 10th graders identify the slope-intercept equation for a line with a given point. Twenty equations are provided on this two-page worksheet.
Other popular searches
- Finding X and Y Intercepts
- Graph Using X and Y Intercepts
- Finding the X and Y Intercepts
- X Y Intercepts Graphing
- Graph X and Y Intercepts
- Graphing X and Y Intercepts
- Y X Intercepts


