Curated OER
Proportionality in Tables, Graphs, and Equations
Students create different methods to analyze their data. In this algebra lesson, students differentiate between proportion and non-proportional graph. They use the TI-Navigator to create the graphs and move them around to make their...
Virginia Department of Education
Slope-2-Slope
Pupils build on previous experience with slope to investigate positive, negative, zero, and undefined slope. They complete a puzzle matching slope-intercept and standard forms of linear equations.
Curated OER
Graphing Review
Pupils review the principles of graphing linear functions. They discuss plotting points on a coordinate plane, solving using a table, and then graphing. Students solve problems and determine the slope of the line, y-intercept and if...
Curated OER
Graphs of Quadratic Equations
In this math worksheet, students solve the problems that ask for the graph of the parabola. They interpret the quadratic equation for its solutions.
Curated OER
Graphing Linear Equations
Ninth graders review the information that they have already learned
with regard to linear equations and graphical representations. They then assist in combining equations with a graphical element and complete various graphs with this...
Curated OER
Solving Systems by Graphing
Learners solve systems of equation through graphing. In this algebra lesson, students solve linear equations and analyze the result to figure out if there is one solution, no solution or infinitely many solutions. They graph their lines...
Curated OER
Solving Systems of Equations by graphing for Algebra One
Students watch the teacher demonstrate on an overhead projector how to graph various equations before the students try them on their own. They start with pencil and paper; once they grasp the concept they move on to punching in the...
Willow Tree
Linear Relationships
There's just something special about lines in algebra. Introduce your classes to linear equations by analyzing the linear relationship. Young mathematicians use input/output pairs to determine the slope and the slope-intercept formula to...
Illustrative Mathematics
Proportional Relationships, Lines, and Linear Equations
The resource is a good introduction to what makes a proportional relationship between two lines. Discuss the similarities of both lines and the possibility of intersection. Use this opportunity to list other acceptable forms of each...
West Contra Costa Unified School District
Shifting Linear Equations in Function Notation
Time for a shift in thinking! Learners examine translations of linear functions. They use function notation to describe the translation and make connections to the graph.
Illustrative Mathematics
Chicken and Steak, Variation 2
Many organizations put on barbecues in order to make money. In a real-world math problem, the money allotted to purchase steak and chicken at this barbecue is only one hundred dollars. It is up to your potential chefs to figure out how...
Curated OER
Slope of Line
For this algebra worksheet, learners calculate the slope of a line. They graph a linear equation given the slope and y-intercept and identify the slope and y-intercept given a linear graph. There are 15 questions.
Curated OER
Graphing Polynomials
Students graph polynomial equations using different methods. In this algebra lesson, students identify the different ways the x and y values relate in a graph. They solve for x by finding the zero's of the polynomials.
Curated OER
Math Mediator Lesson 10: Slope
Students explore the concept of slope. In this Algebra I lesson, students investigate the definition of slope as rise over run or change in y compared to change in x. The lesson includes a real-world problem in which the height of high...
Willow Tree
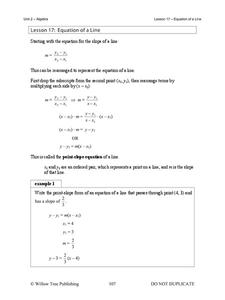
Equations of a Line
Each form of a linear equation has its purpose — pupils just have to find it. Building on the previous activity in the series, learners examine point-slope and standard form. Using point-slope form, pupils write the equation of a...
Curated OER
Worksheet 24
In this math worksheet, students work with three dimensional graphing. The application problems include surface ships on maneuvers determining a submarine's course, helicopter travel, and proving that four points are coplanar. Students...
Curated OER
Linear Equations Data Tables
Students graph linear equations on a Cartesian plane. After describing data tables and their use, students explore how the information from a table can be used to create a line graph. They discuss reasons for plotting a minimum of...
Curated OER
Writing Equations from a Table
Students use coordinates in a table to write equations. For this algebra lesson, students discuss rate of change as it relates to slope and x and y values. They plot the points from a table to graph their lines and write an equation for...
Curated OER
The Phone Bill Problem
Students write an equation for a linear function. For this algebra lesson, students collect data, plot it and graph it. They identify the equation of the graphed data and define the slope and y-intercept of the graph.
Curated OER
Properties of Logarithms
Students explore the concept of logarithms. In this logarithms instructional activity, students graph logarithms on their Ti-Nspire calculator. Students describe the shapes of their graphs by identifying slope, y-intercepts, and...
Virginia Department of Education
Transformationally Speaking
Young mathematicians explore transformations of graphs by graphing sets of functions on the same pair of axes. They use their graphs to determine the effect that the values of a and b in y = ax + b have on the graph of y = x.
Virginia Department of Education
Functions 2
Demonstrate linear and quadratic functions through contextual modeling. Young mathematicians explore both types of functions by analyzing their key features. They then relate these key features to the contextual relationship the function...
West Contra Costa Unified School District
Comparing Linear and Quadratic Functions
If a linear function and a quadratic function enter a boxing match, which one would win? Learners first review how to find key features of linear and quadratic functions. Next, they compare key features of pairs of functions.
Curated OER
More with Graphing and Intercepts
In this math worksheet, students graph the equations through recognizing the position of the intercepts. They also create a function table for each.


