CK-12 Foundation
Evaluate Limits Using Graphs and Tables: Where Is That Limit?
Limits are made easy through graphs and tables. An easy-to-use interactive lets users change a function on a coordinate plane. They relate graphs and tables to the limit at a specific value.
CK-12 Foundation
Concept of Limit: Limit Notation
Limits to infinity are simple to find if you can compare numerators and denominators. Users of the interactive drag expressions to match with their limit as x approaches infinity. A set of challenge questions assesses their groupings.
CK-12 Foundation
Find Imaginary Solutions: Imaginary Zeros
The resource is the real deal. Individuals investigate the imaginary zeros of f(x) = x^2 + 1. They accomplish this task by using an interactive that shows input values x = a + bi and output values x^2 + 1 on a complex plane.
CK-12 Foundation
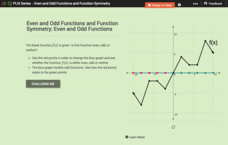
Even and Odd Functions and Function Symmetry: Even and Odd Functions
Even, odd, or neither? Pupils study even and odd functions using a well-balanced interactive. They determine whether a given function is even or odd from its graph.
CK-12 Foundation
Continuous Interest
Continue teaching your financial scholars about interest. A slider interactive has users investigate the growth of an account earning continuous interest. A set of challenge questions has them solve problems given a variety of situations.
CK-12 Foundation
Compound Interest per Period: Credit Card Payment
Credit cards can be convenient, but are they worth it? Future consumers learn about compound interest and credit card payments. They use an interactive to create a table that shows the remaining balance after each month.
CK-12 Foundation
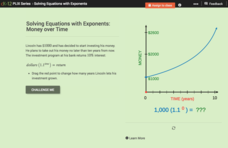
Solving Equations with Exponents: Money Over Time
We'd all like to see our money double. An interactive shows how an initial investment of $1,000 will increase using a constant rate of return. Scholars answer a set of challenge questions based on the situation.
CK-12 Foundation
Proofs: Angle Pairs and Segments—The Three Angle Problem
Finding the sum of the measures of three angles is easy, unless you have no clue what the measures are. Learners use an interactive diagram to see a geometric problem in a different way. A set of challenge questions takes them through...
CK-12 Foundation
Parallel and Perpendicular Lines: Identify Types of Lines
Are there only three options: parallel, perpendicular, or intersecting? Scholars move a given line in an interactive to change its orientation with respect to another line. The interactive indicates whether the lines are parallel,...
CK-12 Foundation
Regular and Irregular Polygons: Polygon States
Colorado would probably object if Wyoming enlarged its borders. Scholars use an interactive map to change the borders of U.S. states to see how angles change. They then answer questions about regular and irregular polygons.
CK-12 Foundation
Restricted Domain and Range: Translation of a Curve
Moving the graph of a function obviously changes its domain and range. Scholars adjust the location of a graph in an interactive coordinate plane. The interactive automatically updates and displays the domain and range to show how it...
CK-12 Foundation
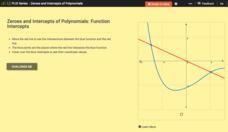
Zeroes and Intercepts of Polynomials: Function Intercepts
There is zero reason not to use the resource. Given a graph with a polynomial function and a linear function, scholars move the line in an interactive. To wrap up the lesson, they note how zeros and intersection points change.
CK-12 Foundation
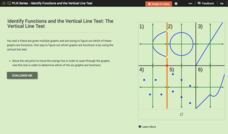
Identify Functions and the Vertical Line Test: The Vertical Line Test
There's no easier test than the vertical line test. Learners drag a vertical line across the graphs of several relations in an interactive. They answer a set of challenge questions that focus on whether the graphs represent functions.
CK-12 Foundation
Sampling Distribution of a Sample Mean: The Mean of the Average Ages
What does it mean to take the mean of the mean? An easy-to-use interactive has users adjust the mean ages of different samples. Finding the average of these sample means gives an estimate of the population mean.
CK-12 Foundation
Slope of a Tangent Line: Slope of the Tangent and Secant Lines
Learn to find the slope through a single point. The interactive provides a visualization of how to find the slope of a tangent line. With the aid of the visualization, pupils see the definition of the derivative in action. Class members...
CK-12 Foundation
Average and Instantaneous Rates of Change
How can you determine the rate of change on a curve? Pupils use the interactive to discover what happens with the average rate of change as the point move closer to the other. Using the definition of the derivative, learners find that it...
CK-12 Foundation
Intermediate Value Theorem, Existence of Solutions: Function Exploration
Does the value exist? The interactive allows pupils to visualize the Intermediate Value Theorem. Using the visualization, individuals respond to questions using specific values and general values. The class comes to the conclusion what...
CK-12 Foundation
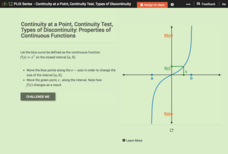
Continuity at a Point, Continuity Test, Types of Discontinuity: Properties of Continuous Functions
Take a closer look at continuous functions within given intervals. Using the parent cubic function, learners explore properties of continuous functions on intervals. Pupils interpret the Intermediate Value Theorem and the Extreme Value...
CK-12 Foundation
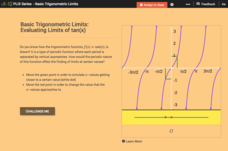
Basic Trigonometric Limits: Evaluating Limits of tan(x)
Chase a periodic moving limit. Learners graphically determine the limit of the tangent function at different input values. Using sliders, pupils find out whether the tangent function approaches the same value from the left and the right....
CK-12 Foundation
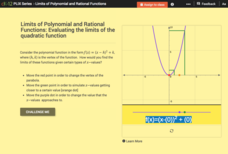
Limits of Polynomial and Rational Functions: Evaluating the Limits of the Quadratic Function
Push an engaging resource to the limit. The interactive allows learners to find a limit on quadratic functions graphically. Using sliders, pupils set the x-value for the limit and to move values from the left and right toward the limit.
CK-12 Foundation
Variance of a Data Set
Use variable value sliders to understand variance. The interactive shows four whole numbers, their mean and deviation. Using the information, pupils find the variance of the numbers and respond to question related to the understanding of...
CK-12 Foundation
Infinite Limit Type: Evaluating Limits of Rational Functions
Rational functions become less mysterious when you know about limits. Individuals use an interactive to move a rational function on a coordinate plane and to investigate function values for certain x-values. They see how the limit...
CK-12 Foundation
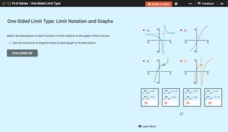
One-Sided Limit Type: Limit Notation and Graphs
A one-sided limit is no less important than a two-sided limit. Young mathematicians use an interactive to match limit notation to graphs. The exercise requires interpreting how one-sided limits connect to features of graphs.
CK-12 Foundation
Evaluate Limits Using Graphs and Tables: Evaluate the Limits
Discontinuities in the graph? No worries. Pupils investigate the limit of a function given graphically using an interactive. The graph has removable and jump discontinuities.


