CK-12 Foundation
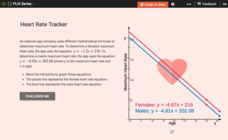
Graphs of Linear Systems: Heart Rate Tracker
Max out heart rates for males and females. Formulas of maximum heart rates provide the equations for a linear system. Pupils use the interactive to graph the equations for males and females and determine their points of intersection. The...
CK-12 Foundation
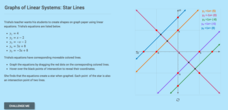
Graphs of Linear Systems: Star Lines
Let the class stars shine. Using four given linear equations, scholars create a graph of a star. The pupils use the interactive to graph the linear systems and determine the points of intersection. Through the activity, classmates...
CK-12 Foundation
Line Graphs to Display Data Over Time: Strawberry Competition
Take the tediousness out of graphing. Using the interactive tool, learners can efficiently create a line graph from a set of data. They then use the graph to answer questions about specific trends in the data.
CK-12 Foundation
Evaluate Limits Using Graphs and Tables: Where Is That Limit?
Limits are made easy through graphs and tables. An easy-to-use interactive lets users change a function on a coordinate plane. They relate graphs and tables to the limit at a specific value.
CK-12 Foundation
Quadratic Functions and Their Graphs: Soccer Ball Trajectory
Determine critical points in the flight of a soccer ball. Pupils use an interactive resource to find the vertex and x-intercepts of the graph of the trajectory of a soccer ball after being kicked. Scholars investigate the trajectory...
CK-12 Foundation
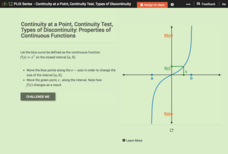
Continuity at a Point, Continuity Test, Types of Discontinuity: Properties of Continuous Functions
Take a closer look at continuous functions within given intervals. Using the parent cubic function, learners explore properties of continuous functions on intervals. Pupils interpret the Intermediate Value Theorem and the Extreme Value...
CK-12 Foundation
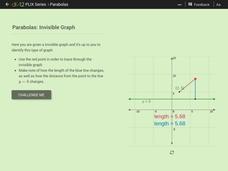
Parabolas: Invisible Graph
Envision the function as the point swings. Given a point connected to another point and a line, pupils trace through an invisible graph. Learners identify the name of the given point and the line and determine the type of conic section...
CK-12 Foundation
Graphs in the Coordinate Plane: Functions on a Cartesian Plane
Connect the dots to graph a linear function. Young mathematicians use an interactive to first plot provided points on a coordinate plane. They connect these points with a line and then answer questions about the slope and y-intercept of...
CK-12 Foundation
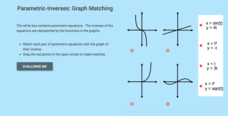
Parametric-Inverses: Graph Matching
Perform a switch to find the inverse of a parametric equation. Pupils match four parametric functions with the graph of the their inverses. Using the graphs, learners determine whether particular points are on the original parametric...
CK-12 Foundation
Function Rules based on Graphs: Making Money in the Hat Business
Hats off to those learning about the graphs of functions. Individuals use an interactive to plot points representing profits for a hat business. They identify a quadratic equation to represent this function and answer challenge questions...
CK-12 Foundation
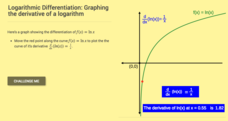
Logarithmic Differentiation: Graphing the Derivative of a Logarithm
Log the values of the derivative of a logarithm. The interactive plots the derivative of the natural logarithm. Learners first determine the derivative of natural logarithm and the general logarithm. Using the formulas for the...
CK-12 Foundation
Graphs for Discrete and for Continuous Data: Discrete vs. Continuous Data
Not all data is the same. Using the interactive, pupils compare data represented in two different ways. The learners develop an understanding of the difference between discrete and continuous data and the different ways to represent each...
CK-12 Foundation
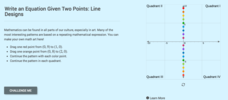
Graphs of Linear Functions: Line Designs
Designs from lines are sublime. Scholars create colorful designs by connecting points on an interactive coordinate plane. They answer questions about slope and quadrants based on their designs.
CK-12 Foundation
Intercepts by Substitution: Finding a Linear Product Using a Quadratic
Discover another way to interpret multiplication. Using an interactive, learners slide points (representing the factors of multiplication) along the x-axis of the graph of y = x^2 and observe changes in the line segment connecting the...
CK-12 Foundation
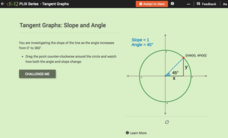
Tangent Graphs: Slope and Angle
Learning about tangents doesn't have to be a slippery slope. Pupils drag a point around a unit circle to see how angle affects the slope of a line. They individually answer a set of challenge questions to come to the conclusion that...
CK-12 Foundation
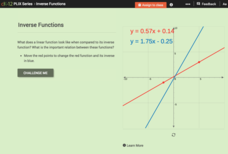
Inverse Functions
Provide a graphical view of inverses. Pupils manipulate points on a line and see the relationship of the graph with the graph of its inverse. Using the relationship between the graphs, scholars respond to questions concerning inverses...
CK-12 Foundation
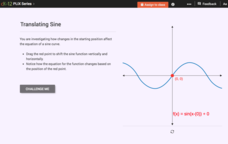
Translating Sine and Cosine Functions: Translating Sine
Learn how to slide sine back and forth and up and down. Pupils move the starting point of a graph of sine vertically and horizontally. They investigate the changes to the equation of the graph in relationship to the translation. They...
CK-12 Foundation
Checking Solutions to Inequalities: Apples and Bananas Shopping Excursion
Go bananas over a fun interactive! Learners drag a point on a virtual graph of an inequality to see if it is a solution. This helps determine the possible numbers of apples and bananas a shopper can buy with a given amount of money.
CK-12 Foundation
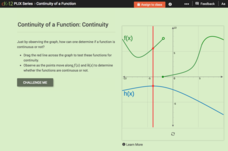
Continuity of a Function: Continuity
Does the point continually move along the graph? Pupils drag a line across two functions to determine whether they are continuous or not. They answer questions about the properties of continuous and discontinuous functions. Using their...
CK-12 Foundation
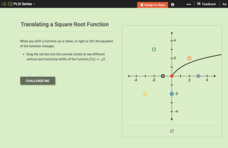
Vertical Translations: Translating a Square Root Function
How does the equation of a function reflect translations? Scholars manipulate the starting point of the parent square root function before determining the new equations that result from the translations. Class members also determine the...
CK-12 Foundation
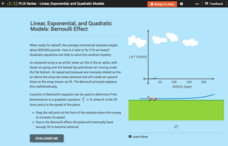
Linear, Exponential, and Quadratic Models: Bernoulli Effect
How can an object as heavy as an airplane fly? Turns out the answer is quadratic! Your classes explore the Bernoulli Effect through an interactive graph representation. As a plane increases in speed, the lift force also increases. Young...
CK-12 Foundation
Vertical Line Test: Exploration
What do vertical lines have to do with functions? Individuals slide a vertical line through four different graphs. They use that vertical line test to determine if the graphs represent functions.
CK-12 Foundation
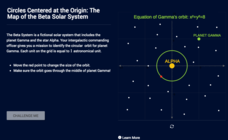
Circles Centered at the Origin: The Map of the Beta Solar System
Calculate galactic orbits in a far-out resource. Pupils drag a point on a circle to graph the orbit of a fictional planet. Using the equation, they find points through which the orbit passes. To finish the simulation, users determine the...
CK-12 Foundation
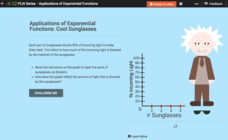
Exponential Decay: Cool Sunglasses
Who wouldn't want to wear four pairs of sunglasses? Each pair of sunglasses reduces the percent of incoming light by one-half. An interactive tutorial helps young mathematicians build a graph that models this scenario. They...
Other popular searches
- Graphing Points Picture
- Graphing Points Activity
- Art From Graphing Points
- Graphing Points on a Grid
- Halloween Graphing Points
