Shodor Education Foundation
Data Flyer
Fit functions to data by using an interactive app. Individuals plot a scatter plot and then fit lines of best fit and regression curves to the data. The use of an app gives learners the opportunity to try out different functions to see...
Kenan Fellows
Least Squares Linear Regression in R
The task? Determine the how effective hospitals are at reducing the rate of hospital-acquired infections. The method? Data analysis! Using an open source software program, individuals use provided data and create scatterplots to look for...
CK-12 Foundation
Mode: Boxes of Oranges
See how your data stacks up. Pupils stack crates of oranges in increasing order, creating a simple bar graph. Using the graph, individuals determine measures of center and describe the shape of the distribution. Scholars determine what...
Statistics Education Web
The United States of Obesity
Mississippi has both the highest obesity and poverty rate in the US. Does the rest of the data show a correlation between the poverty and obesity rate in a state? Learners tackle this question as they practice their skills of regression....
Curated OER
Lesson Plan Outline for Rainbow Science
Young scientists study light reflection and refraction as they determine the critical angle, the rainbow angle, and color separation in rainbows. Teams record the data they collect in a shared spreadsheet and discuss results with the class.
Lane Community College
Review Sheets: Beginning Algebra
This jumbo worksheet contains everything you need to get through Pre-Algebra. Begin with simple expressions, and end with linear functions and polygons. There are multiple problems for each topic to make sure those skills are set.
Willow Tree
Histograms and Venn Diagrams
There are many different options for graphing data, which can be overwhelming even for experienced mathematcians. This time, the focus is on histograms and Venn diagrams that highlight the frequency of a range of data and overlap of...
CK-12 Foundation
Capacitor Simulation
The camera flash works based on a simple circuit, but why does it require a capacitor? Scholars work through two levels of simulations related to circuits and capacitors. The pupils first use a simple circuit with a battery,...
Curated OER
Motion on an Inclined Plane
In this physics worksheet, students model the acceleration, velocity, and position of a cart moving up an inclined plane. They take data and determine a pattern in the data. Students also describe their findings and create an illustration.
University of Colorado
The Moons of Jupiter
Middle schoolers analyze given data on density and diameter of objects in space by graphing the data and then discussing their findings. This ninth installment of a 22-part series emphasizes the Galilean moons as compared to other...
Midnight Martian
Moon Globe
Not just a simple globe of the moon, this interactive version allows you to choose lighting according to the location of the sun, views from different positions on Earth, and more! Satellite images and topographic data have been combined...
Beauty and Joy of Computing
Nesting Lists
Create lists within lists. The second lab in a series of five in the unit has pupils develop a simple contact list app. The tasks within the lab build the need for an abstract data type. Individuals build more complexity into their...
Artisan Global
QuakeFeed Earthquake Map, Alerts and News
Amateur seismologists explore Earth's earthquakes in real time using a variety of map styles and parameter selections.
University of North Carolina
Figures and Charts
Sometimes words aren't the best way to get information across to the reader. The eighth handout in the 24-part Writing the Paper series describes different type of figures and charts to display complex information in a paper....
T. Smith Publishing
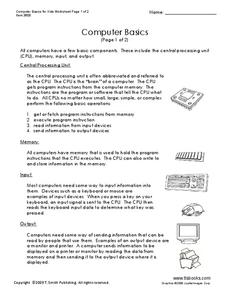
Computer Basics for Kids Worksheet
This informational reading worksheet can be used in your literacy or computer class. Learners learn the basic components of computers then test their knowledge with multiple choice and fill-in-the-blank questions.
Super Duper Publications
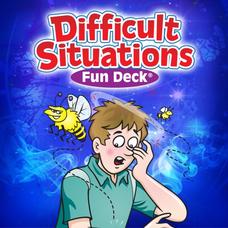
Difficult Situations Fun Deck
What would you do? Fifty-six illustrated picture flash cards provide players with an opportunity to talk about difficult situations, practice responses to awkward or uncomfortable situations, and consider how to deal with dangerous...
US Department of Education
Nces Kids: Creating an Area Graph
This is where you will find step by step directions explaining how to create an area graph. Complete each step and click on the next tab. Directions are simple and clear.


