CK-12 Foundation
Identify Functions and the Vertical Line Test: The Vertical Line Test
There's no easier test than the vertical line test. Learners drag a vertical line across the graphs of several relations in an interactive. They answer a set of challenge questions that focus on whether the graphs represent functions.
Shodor Education Foundation
Vertical Line Test
Connect the points to create a function. Using points given by the applet, pupils try to connect them to create a line that would pass the vertical line test. The resource keeps track of the number of sets the learner is able to identify...
CK-12 Foundation
Vertical Line Test: Exploration
What do vertical lines have to do with functions? Individuals slide a vertical line through four different graphs. They use that vertical line test to determine if the graphs represent functions.
Curated OER
Lesson #46: Bar Graphs and Line Graphs
In this bar graphs and line graphs activity, students interpret bar graphs, line graphs, and box-and-whisker plots. They find the measures of central tendency. This three-page activity contains notes, vocabulary, and...
CK-12 Foundation
Algebraic Functions: Vertical Line Test
To be (a function) or not to be (a function). An easy-to-use interactive has pupils drag a vertical line onto several graphs to determine if they represent functions. Some challenge questions assess understanding of this idea.
Del Mar College
All About Lines
This resource should be called "All About Lines, and Then Some!". Packed full of all the key components of linear functions, learners review how to set up different equations, find intercepts, and graph. All the main topics are included...
CK-12 Foundation
Horizontal and Vertical Line Graphs
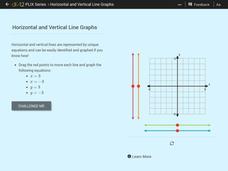
See how vertical and horizontal lines have special equations. Scholars drag vertical and horizontal lines onto a coordinate plane to graph given equations. They then answer a set of challenge questions on the topic.
Curated OER
Presentation of Quantitative Data- Vertical Line Diagrams
For this quantitative data worksheet, students examine how vertical line diagrams can be used to display discrete quantitative data. They read about the use of tally charts to create vertical line graphs that display the data. They...
Curated OER
Quantitative Data
In this quantitative data worksheet, pupils compute measures of central tendency, draw vertical line diagrams, and compare collected data. This 23-page worksheet contains approximately 100 multi-step problems. Explanations and examples...
Curated OER
Parallel and Perpendicular Lines
Young geometers get some solid skills practice in evaluating slopes. Beginning with the basics of slope through two points and progressing through properties of parallel and perpendicular lines, the building of skills is gradual and...
Balanced Assessment
Dollar Line
Challenge the class to develop a story that matches a graph. The short assessment provides a line graph with the vertical axis labeled as dollars. The task asks pupils to develop a description of a situation that could be represented by...
Willow Tree
Parallel and Perpendicular Lines
Enhance your class's understanding of linear equations by extending their study to parallel and perpendicular lines. Young mathematicians learn the relationship between the slopes of parallel and perpendicular lines. They then use that...
K-5 Math Teaching Resources
Blank Bar Graph Template
This template is just begging for your young mathematicians to fill it in with colorful bar graphs! With horizontal and vertical axes in place and grid lines for added support, this is a great resource for teaching children how...
Mt. San Antonio Collage
Quadratic Functions and Their Graphs
Starting with the basics, learners discover the features of a parabola and the ways to accurately graph it. After pupils practice with graphing, the end of the worksheet focuses on application type problems.
Curated OER
Which Graphs are Functions?
In this graphing worksheet, students use the vertical line test to determine if graphs are functions. This two-page worksheet contains 8 problems.
Curated OER
Contour and Cross-Section Skills
In this geography worksheet, learners identify the Wolf Creek Crater and how it was formed. They examine a contour map given of how the crater would look from above. Then, pupils use a ruler to draw lines as on the graph to the side....
Willow Tree
Slope
Investigate the different types of slope using graphs and ordered pairs. Scholars use the slope formula to determine the slope of a line between two points. Includes examples with a slope of zero and with no slope. The lesson follows a...
Khan Academy
Challenge: Lined Paper
Now create your own graph paper with this JavaScript programming activity! First, change the while loop that draws horizontal lines into a for loop. Then, add another for loop that draws the vertical lines. For an added challenge,...
Mt. San Antonio Collage
Graphs of Rational Functions
Sometimes graphing rational functions can feel a little "irrational." Starting with the basics, learners work their way through the pieces of these graphs and finish off with an application question.
Curated OER
Reading Line Graphs
In this line graphs learning exercise, 4th graders, after studying a line graph illustrating Emily's hiking record, answer 4 short answer questions relating to the line graph.
CK-12 Foundation
Linear and Non-Linear Function Distinction: Domain and Range of a Function
Functions are special types of relations, but what makes them so special? Pupils use an interactive to slide a vertical line across six different graphs. Ten challenge questions then assess understanding of functions.
Curated OER
Frequency Tables; Discrete Ungrouped Data
In this frequency tables worksheet, students utilize given data to work out three frequency charts with one containing values and a pie chart involving angles for each value. Students complete three vertical line diagrams and check all...
Curated OER
Graphing a Line Parallel to an Axis
In this Algebra I/Algebra II activity, students graph lines parallel to an axis. The one page activity contains one multiple choice question with the answer.
Mt. San Antonio Collage
Test 1: Graphing Functions
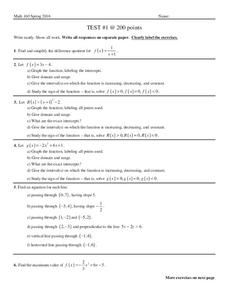
Graph the night away with all the different types of functions provided in the worksheet. Linear, quadratic, and rational all ask for graphs, domain and range and other key factors about the functions.


