Hi, what do you want to do?
Flipped Math
Introduction to Probability
Chances are good that one will learn a lot about probability. Scholars view an instructional video that covers the basics of probability. They review sample spaces, outcomes, and events, then look at the complement, union, and...
Flipped Math
Frequency Tables
What's the association? Pupils watch a presentation on creating a two-way frequency table. Learners find out how to calculate relative frequencies within the table to determine whether there is an association between the two categories....
Crash Course
Charts Are Like Pasta - Data Visualization Part 1: Crash Course Statistics #5
Clever marketers can use visual statistics to mislead their target populations. Explore these visual misrepresentations with a video lesson from a larger statistics playlist. The lesson instructor explains visual representations of both...
PBS
Real-Life Math | Baseball
The math in baseball is more than just batting averages. The Assistant General Manager of the Diamondbacks shows the numerous ways the management uses baseball math. The class participates in an activity to simulate batting averages and...
statisticsfun
How to Calculate Sample Size and Margin of Error
Explore the effect sample size has on margin of error and confidence interval. The instructor calculates the margin of error of fictional data. He shows how the calculation changes when the sample size changes while keeping the other...
Mathed Up!
Two Way Tables
When presented with categorical data, a two-way frequency table is a great way to summarize the information. Pupils organize categorical data using a two-way table, then use the tables to determine missing data and to calculate simple...
Khan Academy
Khan Academy: Video Games and Violence
In this video lesson students look at a set of data, transfer the data into a two-way table and then use that table to make inferences about the data.
Annenberg Foundation
Annenberg Learner: Against All Odds: Histograms
Meteorologists use histograms to map when lightning strikes and this visualization technique helps them understand the data in new ways. [9:42]
Virtual Nerd
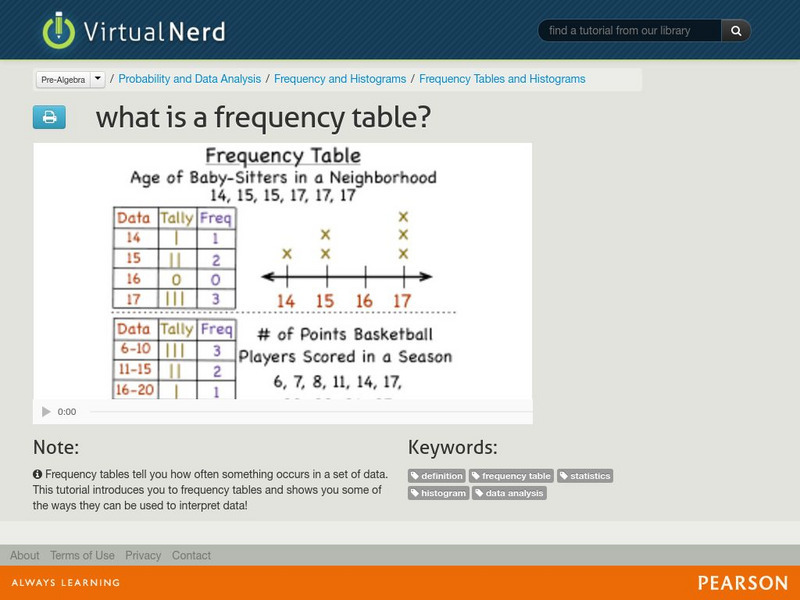
Virtual Nerd: What Is a Frequency Table?
Video serves as an introduction to frequency tables which tell you how often something occurs in a set of data. [6:44]
Virtual Nerd
Virtual Nerd: How Do You Find Relative Frequency?
Relative frequency is how often something happens divided by all the outcomes. Watch this tutorial to learn all the steps needed to find the relative frequency. [3:25]
Sophia Learning
Sophia: Frequency Distributions and Histograms
Explore how to use frequency distribution to organize data and determine the difference between histograms and bar graphs.
Imagine Learning Classroom
Learn Zillion: Calculate Probabilities by Using Data in a Two Way Frequency Table
In this video, you will learn how to calculate probabilities by using the data represented in a two-way frequency table. [6:48]
Imagine Learning Classroom
Learn Zillion: Construct a Two Way Table From a List
In this lesson, students learn how to construct a two-way table by collecting and organizing data from a verbal description. [4:14]
Texas Education Agency
Texas Gateway: Study Edge Statistics: Categorical and Quantitative Data
This lesson explains what categorical and quantitative data are in the context of statistics. Includes downloadable study guide with exercises - guide also covers other topics. [6:26]
Khan Academy
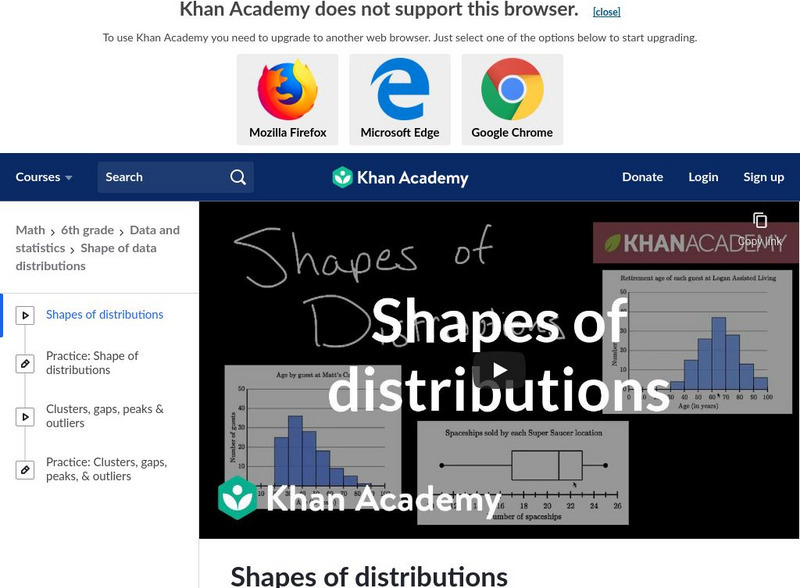
Khan Academy: Shapes of Distributions
This video discusses how to interpret a data display by looking at patterns and anomolies in the shape of its distribution. [5:06]
Khan Academy
Khan Academy: Identifying Individuals, Variables and Categorical Var in Data Set
Identifying individuals, variables and categorical variables in a data set.
Khan Academy
Khan Academy: Categorical Data Example
Sal breaks down some categorical data on video games and violence.
Other
Qlik: Understanding Data
This course is designed to help users gain an understanding of Data, learn about different types and attributes of data, and help them understand why this information is important in the world today. Includes two videos (25 min....
Crash Course
Crash Course Statistics #25: Bayes in Science and Everyday Life
View some examples of how Bayesian inference can be used for continuous data sets and be applied both in science and everyday life in this video. [11:13]
Khan Academy
Khan Academy: Filling Out Frequency Table for Independent Events
Give the row and column totals, Sal fills in the cells of a frequency table so that the events are independent.
Sophia Learning
Sophia: Extreme and Mild Outliers
This lesson discusses how mild and extreme outliers are represented on a box plot.
Sophia Learning
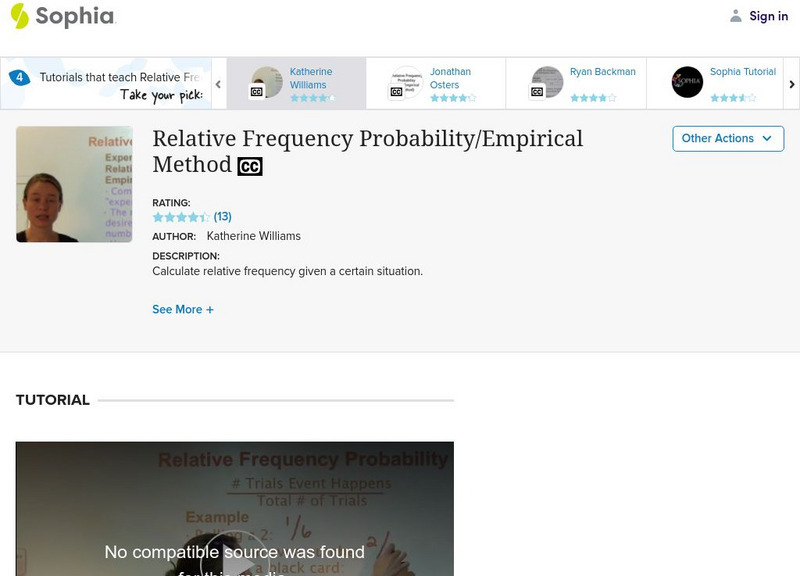
Sophia: Relative Frequency Probability/empirical Method: Lesson 2
This lesson will introduce experimental and subjective definitions of probability. It is 2 of 3 in the series titled "Relative Frequency Probability/Empirical Method." Includes short quiz. [7:12]
Sophia Learning
Sophia: Two Way Tables/contingency Tables: Lesson 3
This lesson will explain two-way tables. It is 3 of 3 in the series titled "Two-Way Tables/Contingency Tables." A transcript accompanies the video. [3:45]


