Newspaper Association of America
By the Numbers: Mathematical Connections in Newspapers for Middle-Grade Students
A cross-curricular resource teaches and reinforces mathematical concepts with several activities that use parts of a newspaper. Scholars use scavenger hunts to find the different ways math is used in the paper along with using data...
Rice University
Introductory Statistics
Statistically speaking, the content covers several grades. Featuring all of the statistics typically covered in a college-level Statistics course, the expansive content spans from sixth grade on up to high school. Material comes from a...
Pace University
Grades 7-8 Mean, Median, and Mode
Take a central look at data. The differentiated instructional activity provides activities for pupils to calculate central tendencies. Scholars begin choosing three central tendency activities from a Tic-Tac-Toe board. Learners then...
American Statistical Association
Speedster
Catch me if you can. Scholars collect data on reaction time by catching a falling ruler or by using an Internet app. They determine the median of the data, create graphs, and analyze the results. They also compare their data to the rest...
American Statistical Association
Candy Judging
Determine the class favorite. The statistics lesson plan has pupils collect, display, and analyze data. Pairs rank four kinds of candy based on their individual preferences. Working as an entire class, learners determine a way to display...
College Board
2002 AP® Statistics Free-Response Questions Form B
Develop a deeper understanding of statistics. The six released free-response items from the 2002 AP® Statistics Form B involve several concepts that are currently in the regular statistics standards. Teachers see how AP® assessed the...
College Board
2007 AP® Statistics Free-Response Questions Form B
So that is how they do it! Pupils and teachers see how College Board assesses topics using the free-response questions from Form B of the 2007 AP® Statistics test. The six questions are divided in two sections, the first five being more...
College Board
2005 AP® Statistics Free-Response Questions
A little context will go a long way. The six released free-response questions from the 2005 exam, show how AP® Statistics uses context within their problems. Pupils use the questions to practice their statistics skills within real-world...
CCSS Math Activities
Smarter Balanced Sample Items: 6th Grade Math – Target J
What is the best measure of central tendency? Scholars explore mean, median, mode, range, and interquartile range to understand the similarities and differences. They display data in dot plots, histograms, box plots, and more as part of...
College Board
2009 AP® Statistics Free-Response Questions Form B
Is your class taking the AP® Statistics exam in the near future? You may want to take a look here. Using the 2009 AP® Statistics free-response questions Form B helps learners become familiar with the testing conditions, such as time...
College Board
2016 AP® Statistics Free-Response Questions
Test your classes on their knowledge of advanced statistic concepts. Young math scholars get a sneak peek at the end of course AP® statistics exam with the released items from the 2016 test. The six-question free response exam addresses...
CCSS Math Activities
Smarter Balanced Sample Items: 7th Grade Math – Target H
Not one but two box plots. How will your pupils fare? Assess their understanding of box plots by having them compare two populations. The eighth of nine installments in the Gr. 7 Claim 1 Item Slide Shows series, the resource has them...
Mathed Up!
Frequency Tables
The section of a larger General Certificate of Secondary Education math review requires pupils to summarize numerical data presented in a frequency table. Scholars determine the number of data points, the range, the mean, and the...
Corbett Maths
Median for a Frequency Table
Try to find the middle of a frequency table. Using a frequency table of ages, the video shows how to use a formula to determine the position of the median. The resource uses frequency tables with both even and odd numbers of data points.
CCSS Math Activities
Smarter Balanced Sample Items: High School Math – Target P
Learn how to show data in varied ways. A PowerPoint presentation provides six questions from the high school SBAC Claim 1 Target P item specifications. It covers creating data representations, interpreting and comparing data, and...
Corbett Maths
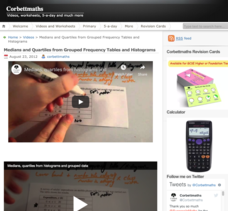
Medians and Quartiles from Grouped Frequency Tables and Histograms
Determine medians within a group. Given data represented as a frequency table of grouped data, the video demonstrates finding an estimation for the median. After finding the group where the median resides, the presenter uses a formula to...
Corbett Maths
The Median
Find the one in the middle. An informative resource explains how to determine the median of a set of numbers. Using both even and odd numbers of data points, the video covers the process of finding the middle number. Worksheets provide...
Concord Consortium
Divisions
Divide and conquer the geometry problem. Young scholars consider how to subdivide triangles into smaller ones that have equal areas. They must apply their knowledge of medians to help accomplish the task.
Concord Consortium
Detective Stories
The truth will always come out. A short performance task has learners considering a witness statement given to a detective. They apply special line segments in triangles and Ceva's Theorem to prove that the witness is actually lying.
Mathematics Vision Project
Module 3: Geometric Figures
It's just not enough to know that something is true. Part of a MVP Geometry unit teaches young mathematicians how to write flow proofs and two-column proofs for conjectures involving lines, angles, and triangles.
Concord Consortium
In Oz We Tryst
The shortest distance from point A to point B is a straight line, but measuring distance gets more complicated when there are three points! Given the location of three friends, individuals determine the best point for all three friends...
American Statistical Association
How Fast Are You?
Quick! Snap up the lesson. Scholars first use an online app to collect data on reaction times by clicking a button when the color of a box changes. They then plot and analyze the data by considering measures of center, measures of...
American Statistical Association
Step into Statastics
Class members study the size of classmates' feet and perform a statistical analysis of their data. They solve for central tendencies, quartiles, and spread for the entire group as well as subgroups. They then write a conclusion based on...
American Statistical Association
What is the Probability of “Pigging Out”
Learners apply their understanding of luck to a probability experiment. They play a game of Pass the Pigs to determine the probability of a specific outcome. Using analysis for their data, pupils declare the measures of center, dot...


