Corbett Maths
Instantaneous Rates of Change
Here's a great lesson that looks at slope as an instantaneous change. Using an estimated tangent line, the presenter shows the class how to find an approximation for the instantaneous rate of change. Scholars determine the slope of the...
PBS
The Lowdown — Poverty Trends: What Does It Mean to Be Poor in America?
Here's a resource that's rich with learning opportunities. Future mathematicians investigate the poverty rate in America over time. They use an interactive to compare the poverty rate during the Great Recession of 2008 to other years,...
CCSS Math Activities
Smarter Balanced Sample Items: 8th Grade Math – Claim 2
Math can be a problem in eighth grade. Sample items show how problem solving exists within the eighth grade standards. Part of the Gr. 8 Claim 2 - 4 Item Slide Shows series, the presentation contains eight items to illustrate the...
CCSS Math Activities
Smarter Balanced Sample Items: 8th Grade Math – Target J
Look at patterns in bivariate data. Eight sample items illustrate the eighth grade statistics and probability standards. The Smarter Balanced Sample multiple-choice items focus on numerical and categorical bivariate data. The slide show...
CCSS Math Activities
Smarter Balanced Sample Items: High School Math – Claim 4
What is the appropriate model? Sample problems show the extent of the Smarter Balanced assessments Claim 4, Modeling and Data Analysis. Items provide pupils the opportunity to use mathematical modeling to arrive at a reasonable answer....
CCSS Math Activities
Smarter Balanced Sample Items: High School Math – Claim 2
Problem solve across the content standards. The presentation slides provide 19 sample items from the Smarter Balanced high school assessment. Items illustrate Claim 2, problem solving, of the test and are drawn from all the high school...
Concord Consortium
Function Project
What if a coordinate plane becomes a slope-intercept plane? What does the graph of a linear function look like? Learners explore these questions by graphing the y-intercept of a linear equation as a function of its slope. The result is a...
Mathematics Vision Project
Module 1: Transformations and Symmetry
No need to change anything about the resource. The first of eight modules in the MVP Geometry unit focuses on transformations in the coordinate plane. It connects translations, rotations, and reflections to congruence, symmetry, and...
Mascil Project
Building a Safe Staircase
Climb up the staircase of engineering knowledge. After watching a video of a carpenter measuring out steps for a set of stairs, pupils learn about the terminology and regulations involving stairs. They see how to use a rule of thumb when...
5280 Math
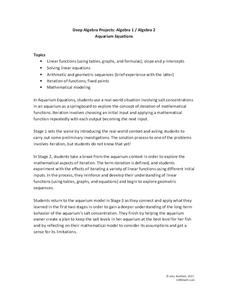
Aquarium Equations
Take a look at linear functions in a new environment. A three-stage algebra project first asks learners to model the salt concentration of an aquarium using linear functions. Then, using iterations, pupils create a set of input-output...
5280 Math
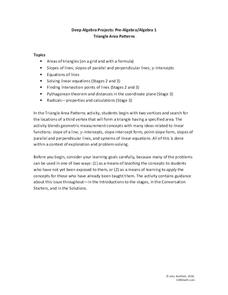
Triangle Area Patterns
Combine algebraic and geometric strategies to find solutions. The task asks learners to find the coordinates of a third vertex of a triangle to create a triangle with a specific area. The project is a set of seven problems that helps...
American Statistical Association
Scatter It! (Using Census Results to Help Predict Melissa’s Height)
Pupils use the provided census data to guess the future height of a child. They organize and plot the data, solve for the line of best fit, and determine the likely height and range for a specific age.
American Statistical Association
Scatter It! (Predict Billy’s Height)
How do doctors predict a child's future height? Scholars use one case study to determine the height of a child two years into the future. They graph the given data, determine the line of best fit, and use that to estimate the height in...
Physics Classroom
Using Graphs
Many university professors complain incoming scholars struggle with interpreting graphs. A skill builder offers three different types of exercises including calculating slope, interpreting graphs, and extrapolating outside the plotted...
Mascil Project
Design a Parking Garage
Parking structures don't build themselves. Investigate the process of designing and planning the construction of a parking garage. After considering the factors that must go into the design, scholars create their own models from a set of...
101 Questions
25 Billion Apps
Learn to use mathematics to your advantage! Using linear modeling, scholars predict the date and time the Apple App Store reaches 25 billion downloads. Considering the prize for the 25 billionth download was a $10,000 gift card, modeling...
Concord Consortium
Be Well
How much do you spend on healthcare each year? Data shows the expenditures in the US rise significantly each year. Young scholars use the data to calculate a rate of change over a 30-year period and look for—as well as provide— possible...
Project Maths
Introduction to Calculus
Don't let your class's heart rates rise as you introduce them to differentiation ... an inquiry-based lesson helps them keep it in check! The second lesson in a three-part series asks learners to analyze the rate of change of different...
101 Questions
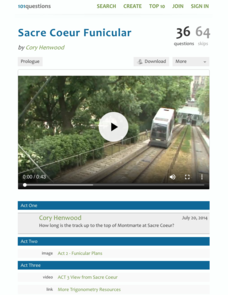
Sacre Coeur Funicular
Rise to the challenge of trigonometry. Watching a video of an ascending funicular at the Sacre Coeur in Paris sets the stage for a challenging task. Young mathematicians use a given diagram, along with the concepts of slope and...
Kenan Fellows
Math Made Simple as 1-2-3: Simplified Educational Approach to Algebra
Writing an equation of a line is as easy as m and b. A lesson presentation gives individuals different strategies for writing equations of lines. Some items provide a slope and a point while others provide two points. Whatever the given,...
101 Questions
The Mystery Line
Take the mystery out of linear functions. Provided an image with no scale, learners guess where the line that connects them might cross the y-axis. After providing the coordinates of the points, they realize scale is an important...
Kenan Fellows
Let's Move
Find a statistical reason for a fresh start. Using a hypothetical scenario, individuals research statistical data of three different cities. Their goal? Find the best statistical reason for a business to move to a new location. Their...
Kenan Fellows
Density
Most scholars associate density with floating, but how do scientists determine the exact density of an unknown liquid? The third lesson in a seven-part series challenges scholars to find the mass and volume of two unknown liquids. Each...
101 Questions
Ditch Diggers
What's the best way to dig a ditch? Scholars watch a video that shows the progress of ditch digging from two ends. Using coordinate geometry, they determine whether two ends will eventually connect to form one single ditch or not.


