Space Awareness
Measure the Solar Diameter
Scientists could measure the diameter of the sun before they knew its distance. Scholars construct a simple mirror box to measure the diameter for themselves. They compare this measurement with the official size, listed in a...
Education Development Center
Making Sense of Unusual Results
Collaboration is the key for this equation-solving lesson. Learners solve a multi-step linear equation that requires using the distributive property. Within collaborative groups, scholars discuss multiple methods and troubleshoot mistakes.
Education Development Center
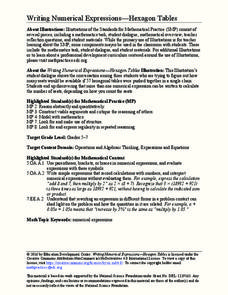
Writing Numerical Expressions—Hexagon Tables
Explore a basic pattern to practice writing expressions. In collaborative groups, learners examine a contextual pattern and write an expression to model it. The task encourages groups to describe the pattern in multiple ways.
Education Development Center
Creating Data Sets from Statistical Measures
Explore the measures of central tendency through a challenging task. Given values for the mean, median, mode, and range, collaborative groups create a set of data that would produce those values. They then critique other answers and...
Education Development Center
Integer Combinations—Postage Stamps Problem (MS Version)
Number patterns can seem mysterious. Help your learners unravel these mysteries as they complete an intriguing task. Through examination, collaborative groups determine that they are able to produce all integers above a certain...
Education Development Center
Consecutive Sums
Evaluate patterns of numbers through an engaging task. Scholars work collaboratively to determine a general rule reflecting the sum of consecutive positive integers. Multiple patterns emerge as learners explore different arrangements.
Education Development Center
Choosing Samples
What makes a good sample? Your classes collaborate to answer this question through a task involving areas of rectangles. Given a set of 100 rectangles, they sample a set of five rectangles to estimate the average area of the figures. The...
Education Development Center
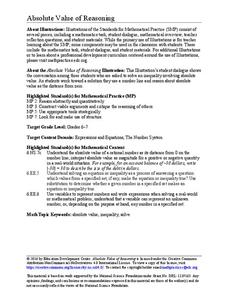
Absolute Value Reasoning
Teach solving absolute value inequalities through inquiry. Groups use their knowledge of absolute value and solving inequalities to find a solution set to an absolute value inequality. Working collaboratively encourages discussion,...
Education Development Center
Finding Triangle Vertices
Where in the world (or at least in the coordinate plane) is the third vertex? Given two coordinate points for the vertices of a triangle, individuals find the location of the third vertex. They read an account of fictional...
Education Development Center
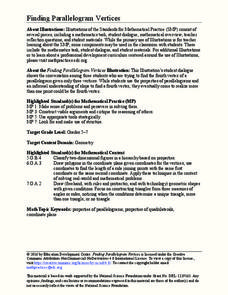
Finding Parallelogram Vertices
Four is the perfect number—if you're talking about parallelograms. Scholars determine a possible fourth vertex of a parallelogram in the coordinate plane given the coordinates of three vertices. They read a conversation...
Howard Hughes Medical Institute
Modeling Food Webs in Darién, Panama
It's a jungle out there! Young biologists journey to Darien, Panama to examine the intricate relationships between the organisms that inhabit the jungle. Groups begin by demonstrating an understanding of energy flow in ecosystems, then...
Howard Hughes Medical Institute
What van Leeuwenhoek Saw
When van Leeuwenhoek saw cells and single-celled organisms for the first time, he knew these small things were a big deal! Share his discoveries with young learners through a narrated video, model-building activity, and scale study....
Curated OER
Nutria And The Disappearing Marsh
Young analysts examine changes in the nutria population, vegetation density, and marsh area over time in the wetlands of Louisiana. They import data and use the TI-73 Explorer to graph and analyze the effects of nutria on marsh loss.
Curated OER
Winter Olympics History Year by Year
Investigate the history of the Winter Olympic Games. After researching this event and compiling necessary statistics, pupils use a graphic organizer to chart their findings. A template for a chart is included in this resource. Have your...
Curated OER
Put Your Truss in Building Bridges
Students apply abstract concepts, such as stress, fulcrums, the law of gravity, and the strength of different geometric shapes. Groups of student contractors operate simulated architectural firms to create strong, economical bridges.
Curated OER
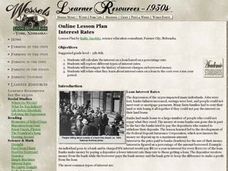
Interest Rates
Use a KWL chart and discussion to explore the concept behind loans with interest based on percentage rates. Learners examine different types of interest, the history of interest loans and calculate the costs of a loan over a ten-year...
Curated OER
Building Big and Strong
Middle and high schoolers explore the concepts of architectural rigidity. They analyze a variety of polygons, and explain why some shapes add more strength to structures than others. The PBS video, "Building Big," is utilized in this plan.
Curated OER
Proving (a Theorem) and Disproving (a Theory)
As a cross-curricular lesson, your class examines the issues of gender discrimination, careers, and gender roles. They read and discuss an article, prepare a proof of the Pythagorean theorem as a class, and develop a creative...
Curated OER
Swinging Pendulum
Students engage in an activity which demonstrates how potential energy (PE) can be converted to kinetic energy (KE) and back again. Given a pendulum height, students calculate and predict how fast the pendulum will swing by understanding...
Curated OER
Pythagorean Theorem by Graphic Manipulation
There are many different ways to show a proof of the Pythagorean Theorem. Here is a nice hands-on paper cutting activity that shows a graphic representation. You can even challenge your young Pythagoreans to come up with their own...
Curated OER
Data Analysis
Young statisticians use and interpret measures of center and spread such as mean, median, and mode as well as range. They use box plots to represent their data and answer questions regarding the correspondence between data sets and the...
Curated OER
My Angle on Cooling
Students explore how the angle and distance of an object can change it's temperature. After reviewing how the position of the Earth affects the temperature of the planet, student groups design and perform an experiment to test how...
Curated OER
Super Ticket Sales
Use this graphing data using box and whisker plots lesson to have learners make box and whisker plots about ticket sales of popular movies. They find the mean, median, and mode of the data. Pupils compare ticket sales of the opening...
Curated OER
Curve Ball
Create a Height-Time plot of a bouncing ball using a graphing calculator. Graph height as a function of time and identify the vertex form of a quadratic equation that is generated to describe the ball's motion. Finally, answer questions...
Other popular searches
- Math and Science
- Math and Science Careers
- Integrated Math and Science
- Science/ Math Games
- Math and Science Activities
- Integrating Math and Science
- +Math and Science Careers
- Math and Science Plan
- Math in Science
- Math Science
- Math and Science Lessons
- Math and Forensic Science


