McGraw Hill
Metric Units of Weight and Volume
Getting the right measurements can save a lot of time and money in the real world. Learners are introduced to unit conversion and how to accurately go from one unit to another. The first pages are notes and then the packet finishes with...
Federal Reserve Bank
It's Your Paycheck
Beyond reading and arithmetic, one of the most important skills for graduating seniors to have is fiscal literacy and responsibility. Start them on the right financial track with nine lessons that focus on a variety of important personal...
Utah Education Network (UEN)
Linear Graphs Using Proportions and Rates
Using a TI-73 or other similar graphing calculator middle school math majors investigate the linear relationship of equivalent proportions. After a brief introduction by the teacher, class members participate in a timed pair share...
PBS
Soul Food Junkies: Portions
Serve up a rate of percents. The Math at the Core resource investigates the percent of daily value of sodium and saturated fats in different foods. Pupils determine the number of serving sizes they eat of popular snack foods and...
Illustrative Mathematics
Jim and Jesse's Money
Jim and Jesse started their road trip with the same amount of money. Your class must find the amount of money each one had given, the amount of money spent, and the ratio of money at the end. This is a comprehensive problem that takes...
Curated OER
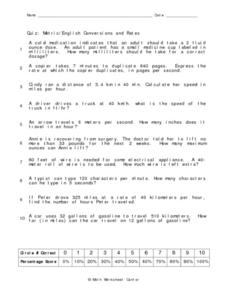
Conversions and Rates
In this conversions and rates worksheet, learners solve 10 different word problems that include using metric conversions and rates to solve each problem. First, they determine the number of milliliters needed for the correct dosage of...
Curated OER
Stock Swaps, Variation 2
If Microsoft wanted to take over Apple, how many shares would they need to break even? This is an ideal task for seventh graders who are studying proportional relationships and applying them to real-world scenarios. Use it as an...
Illustrative Mathematics
Peaches and Plums
According to the resource graph, which costs more: peaches or plums? Algebra learners compare two proportional relationships and then throw in a banana. Leaving out the scale helps students become intuitive about graphing.
Illustrative Mathematics
Sand Under the Swing Set
Help the local elementary school fix their playground by calculating the amount of sand needed near the swing set. The problem practices setting up proportions and ratios with three different options for solving. You can chose the option...
Curated OER
Algebra 1: Slope as Rate
Young scholars solve problems with slopes. In this algebra lesson, students identify the slope of a line and relate it to the rate of change. They graph their lines on the TI and observe changes in the lines.
Illustrative Mathematics
Comparing Speeds in Graphs and Equations
Compare two different proportional relationships on a graph. It is up to your mathematicians to determine which of two moving objects have greater speed. A good example of a Common Core multiple choice question.
Curriculum Corner
7th Grade Math "I Can" Statement Posters
Translate the Common Core math standards into a series of achievable "I can" statements with this collection of classroom displays. Offering posters for each standard, this resource is a great way to support your seventh graders as they...
Illustrative Mathematics
Velocity vs. Distance
At the end of this activity, your number crunchers will have a better understanding as to how to describe graphs of velocity versus time and distance versus time. It is easy for learners to misinterpret graphs of velocity, so have them...
Federal Reserve Bank
Lesson 3: A Fresh Start
The members of your economics class may be busy earning graduation credits, but the credit they should be concerned about is their financial credit. The third lesson in a unit about Hurricane Katrina and other events that can result in...
Illustrative Mathematics
Molly's Run
A simple lesson with a lot of support behind it. Your learners will find out how long it takes Molly to run a mile by choosing their solution method. The activity can be used as a lesson or as an independent assignment. Preface with...
California Education Partners
Animals of Rhomaar
Investigate the growth rates of alien animals. Pupils study fictional animals from another planet to determine how much they grow per year. The investigators plot the growth of their animals over a period of time and then compare them to...
Balanced Assessment
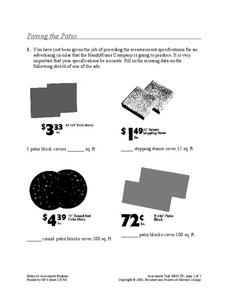
Paving the Patio
Next time you need to repave your patio, have your scholars do all the math. They first calculate and answer questions using the area of patio blocks. Next, they determine the cheapest block to use to pave the patio.
101 Questions
Speed of Light
How quickly does light travel long distances? A short video simulates light going from the earth to the moon at two different paces. Scholars relate the distance to the rate to understand which simulation is correct.
101 Questions
Bean Counting
Don't spill the beans ... before the end of the lesson! Learners must predict how long it takes two people working together to fill a glass with beans. A video presents the rate it takes each person independently, and another video...
Illustrative Mathematics
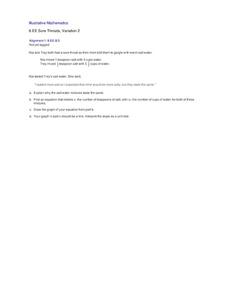
Sore Throats, Variation 2
What does math have to do with a sore throat? When you mix water and salt you have a great review of how to represent proportional relationships by an equation or graph. Here the proportions of the mixtures may be different, but the...
Curated OER
Ratios, Rates, Percent and Nutrition
Examine food labels to determine percentage of fat and sugar to total calories with middle schoolers. Daily nutritional guidelines are discussed and learners will decide how well their foods fit into a healthy diet. In the provided...
Illustrative Mathematics
Buying Gas
A quick problem to test your middle schoolers' knowledge of dividing with decimals. Also a good practice of unit rates, they must compute the cost of one gallon of gas when given the total amount for a fill up. Can be used as a preface...
Illustrative Mathematics
Sale!
Everyone loves a sale, and this worksheet allows learners to calculate which sale is more rewarding. The activity can be adapted for different thinking contexts. The answer key describes different answer choices, some being higher...
Illustrative Mathematics
Find the Change
This exercise is an opportunity for algebra learners to understand the connection between the slope of a line and points found on the line. Use similar triangles to explain why slope m is the same between any two points. Discuss with the...


