Teach Engineering
Applications of Linear Functions
It's not so straightforward — lines can model a variety of applications. Pupils experience linear relationships within the context of science, including Hooke's and Ohm's Laws. Class members got a taste of motion and speed from the...
Bowland
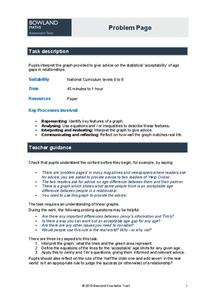
Problem Page
Future mathematicians use a given graph to answer a question about age differences in relationships. Along the way, they must find the equation and inequality of given graphs.
Virginia Department of Education
Exponential Modeling
Investigate exponential growth and decay. A set of six activities has pupils collecting and researching data in a variety of situations involving exponential relationships. They model these situations with exponential functions and solve...
101 Questions
Blocks
Block play can teach children about gravity, physics, and spatial relationships. A hands-on lesson incorporates these concepts with an activity in which learners examine the relationship between levels in a pile. Scholars begin to...
CCSS Math Activities
Smarter Balanced Sample Items: High School Math – Target G
G is for generating equations. Scholars answer eight questions covering the SBAC Claim 1 Target G high school item specifications. They write one-variable and multi-variable equations and inequalities to model relationships between...
Curated OER
Baseball Relationships - Using Scatter Plots
Students use graphing calculators to create scatter plots of given baseball data. They also determine percentages and ratios, slope, y-intercepts, etc. all using baseball data and statistics.
Curated OER
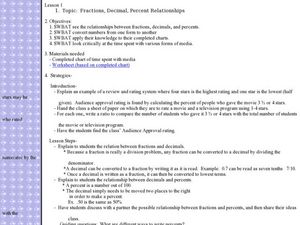
Fractions, Decimal, Percent Relationships.
Students solve problems involving fractions, decimals and percents. In this algebra lesson, students examine the relationship between fractions and percents and between decimals and percents. They convert between percents, decimals and...
Curated OER
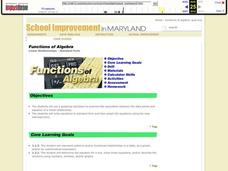
Linear Relationships - Standard Form
Students use a graphing calculator to examine the association between the data points and equation of a linear relationship. They write equations in standard form and then graph the equations using the slop-intercept form. Answer Key...
Curated OER
Classifying Angles
In this classifying angles activity, 10th graders solve and complete 35 various types of problems. First, they match each type of angle with its correct description. Then, students determine whether the given lines or planes are...
Curated OER
Spatial Relationships
Students investigate the geometry concept of spatial relationships. They draw a replica of a cube. Students list the planes on the cube and go into further depth with identifying the parallel line in segments of the cube. The...
Curated OER
Naming Angles 2
In this naming angles worksheet, 10th graders complete 12 problems that identify and name various types of angles in figures. They name a pair of vertical angles and a linear pair in 8 of the problems. Then, students name a pair of...
Balanced Assessment
Gligs and Crocs
Explore relationships between perimeter and area. Learners compare the measurement units of gligs and crocs. They use a given perimeter and area as well as specific measurement relationships to determine the scale of gligs to crocs.
Teach Engineering
Windy Tunnel
Lift—it is about the wing's attack. Using a virtual wind tunnel, pupils investigate wing shape and angle of attack. Learners use worksheets to record their observations and to convert verbal relationships into mathematical equations in...
Curated OER
The Foundation of Math and Science
Students uncover the mathematical proportions as well as the history of the Parthenon. In this math and science instructional activity, students use research to find the contributions of ancient Greeks made to our current society. They...
Illustrative Mathematics
Crude Oil and Gas Mileage
Here is an activity that presents a real-world problem about the relationship between crude oil production and the gas mileage of modern automobiles. After learners write functions to describe the relationships, they are asked to find...
Agile Mind
Rabbit populations
In this real-world problem about the rapid growth of rabbit populations, students must analyze two different scenarios and create mathematical models to represent them. They use their exponential models to answer questions about the...
Illustrative Mathematics
Function Rules
Function machines are a great way to introduce the topic of functions to your class. Here, you will explore the input and output to functions both using numerical and non-numerical data. Learners are encouraged to play with different...
Curated OER
US Airports, Assessment Variation
Determining relationships is all part of algebra and functions. Your mathematicians will decide the type of relationship between airports and population and translate what the slope and y-intercept represent. The problem is multiple...
Charleston School District
Analyzing Scatter Plots
Scatter plots tell a story about the data — you just need to be able to read it! Building from the previous lesson in the series where learners created scatter plots, they now learn how to find associations in those scatter plots. They...
Charleston School District
Two-Way Tables
Do males or females buy more iPhones? Using a two-way frequency table can help to answer this question. Pupils learn to create two-way frequency tables and then how to analyze the data within the tables. Learners find frequencies,...
Willow Tree
Slope
Investigate the different types of slope using graphs and ordered pairs. Scholars use the slope formula to determine the slope of a line between two points. Includes examples with a slope of zero and with no slope. The lesson follows a...
EngageNY
Basic Trigonometric Identities from Graphs
Have young mathematicians create new identities! They explore the even/odd, cofunction, and periodicity identities through an analysis of tables and graph. Next, learners discover the relationships while strengthening their understanding...
EngageNY
Comparing Linear and Exponential Models Again
Making connections between a function, table, graph, and context is an essential skill in mathematics. Focused on comparing linear and exponential relationships in all these aspects, this resource equips pupils to recognize and interpret...
EngageNY
Modeling with Quadratic Functions (part 1)
Relevance is key! The resource applies quadratic modeling by incorporating application of physics and business. Pupils work through scenarios of projectile motion and revenue/profit relationships. By using the key features of the graph,...
Other popular searches
- Healthy Relationships
- Interpersonal Relationships
- Linear Relationships
- Quadratic Relationships
- Ecological Relationships
- Family Relationships
- Symbiotic Relationships
- Angle Relationships
- Family Health Relationships
- Economic Relationships
- Cause and Effect Relationships
- Relationships Among Organisms


