EngageNY
Modeling from a Sequence
Building upon previous knowledge of sequences, collaborative pairs analyze sequences to determine the type and to make predictions of future terms. The exercises build through arithmetic and geometric sequences before introducing...
EngageNY
Modeling a Context from a Verbal Description (part 2)
I got a different answer, are they both correct? While working through modeling problems interpreting graphs, the question of precision is brought into the discussion. Problems are presented in which a precise answer is needed and others...
EngageNY
Distributions and Their Shapes
What can we find out about the data from the way it is shaped? Looking at displays that are familiar from previous grades, the class forms meaningful conjectures based upon the context of the data. The introductory lesson to descriptive...
EngageNY
Describing the Center of a Distribution
So the mean is not always the best center? By working through this exploratory activity, the class comes to realize that depending upon the shape of a distribution, different centers should be chosen. Learners continue to explore the...
EngageNY
Estimating Centers and Interpreting the Mean as a Balance Point
How do you balance a set of data? Using a ruler and some coins, learners determine whether the balance point is always in the middle. Through class and small group discussions, they find that the mean is the the best estimate of the...
EngageNY
Interpreting the Standard Deviation
Does standard deviation work for non-symmetrical distributions, and what does it mean? Through the use of examples, high schoolers determine the standard deviation of a variety of distributions and interpret its meaning. Problems require...
EngageNY
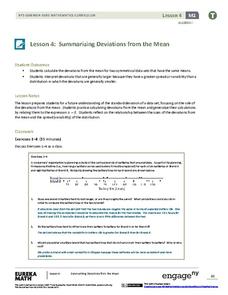
Summarizing Deviations from the Mean
Through a series of problems, learners determine the variability of a data set by looking at the deviations from the mean. Estimating means of larger data sets presented in histograms and providing a way to calculate an estimate round...
EngageNY
Measuring Variability for Symmetrical Distributions
How do we measure the deviation of data points from the mean? An enriching activity walks your class through the steps to calculate the standard deviation. Guiding questions connect the steps to the context, so the process is not about...
EngageNY
More on Modeling Relationships with a Line
How do you create a residual plot? Work as a class and in small groups through the activity in order to learn how to build a residual plot. The activity builds upon previous learning on calculating residuals and serves as a precursor to...
EngageNY
Relationships Between Two Numerical Variables
Is there another way to view whether the data is linear or not? Class members work alone and in pairs to create scatter plots in order to determine whether there is a linear pattern or not. The exit ticket provides a quick way to...
EngageNY
Modeling Relationships with a Line
What linear equation will fit this data, and how close is it? Through discussion and partner work, young mathematicians learn the procedure to determine a regression line in order to make predictions from the data.
EngageNY
Summarizing Bivariate Categorical Data with Relative Frequencies
It is hard to determine whether there is a relationship with the categorical data, because the numbers are so different. Working with a familiar two-way table on super powers, the class determines relative frequencies for each cell and...
EngageNY
Summarizing Bivariate Categorical Data
How do you summarize data that cannot be averaged? Using an exploratory method, learners complete a two-way frequency table on super powers. The subject matter builds upon 8th grade knowledge of two-way tables.
EngageNY
Conditional Relative Frequencies and Association
It is all relative, or is it all conditional? Using an exploration method, the class determines whether there is an association between gender and superpower wish through the use of calculating conditional relative frequencies. The last...
EngageNY
Interpreting Correlation
Is 0.56 stronger than -0.78? Interpret the correlation coefficient as the strength and direction of a linear relationship between two variables. An algebra lesson introduces the correlation coefficient by estimating and then calculating it.
EngageNY
Relationships Between Two Numerical Variables
Working in small groups and in pairs, classmates build an understanding of what types of relationships can be used to model individual scatter plots. The nonlinear scatter plots in this instructional activity on relationships between two...
EngageNY
Analyzing a Graph
Collaborative groups utilize their knowledge of parent functions and transformations to determine the equations associated with graphs. The graph is then related to the scenario it represents.
EngageNY
Analyzing a Verbal Description
What function will describe the insect population growth? Pairs or small groups work together to determine which type of function and specific function will model given scenarios. The scenarios differentiate between linear, exponential...
EngageNY
Modeling a Context from Data (part 1)
While creating models from data, pupils make decisions about precision. Exercises are provided that require linear, quadratic, or exponential models based upon the desired precision.
EngageNY
Modeling a Context from Data (part 2)
Forgive me, I regress. Building upon previous modeling activities, the class examines models using the regression function on a graphing calculator. They use the modeling process to interpret the context and to make predictions based...
EngageNY
Modeling a Context from a Verbal Description (part 1)
When complicated algebraic expressions are involved, it is sometimes easier to use a table or graph to model a context. The exercises in this lesson plan are designed for business applications and require complex algebraic expressions.
Whitman College
Calculus - Early Transcendentals
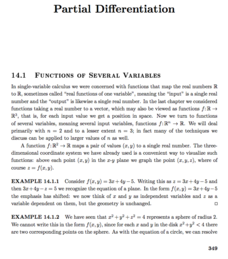
This textbook takes the learner from the basic definition of slope through derivatives, integrals, and vector multivariable calculus. Each section is composed primarily of examples, with theoretical introductions and explanations in...
EngageNY
What Is Area?
What if I can no longer justify area by counting squares? Lead a class discussion to find the area of a rectangular region with irrational side lengths. The class continues on with the idea of lower approximations and upper...
EngageNY
Properties of Area
What properties does area possess? Solidify the area properties that pupils learned in previous years. Groups investigate the five properties using four problems, which then provide the basis for a class discussion.
Other popular searches
- History of Mathematics
- Discrete Mathematics
- Mathematics Line Symmetry
- Everyday Mathematics
- Montessori Mathematics
- Writing in Mathematics
- Mathematics Mode and Median
- Applied Mathematics
- Mathematics Times Tables
- Christmas Mathematics
- B Ed Mathematics
- Discrete Mathematics Graph


