Mathematics Assessment Project
Interpreting Distance–Time Graphs
Pre-algebra protégés critique a graph depicting Tom's trip to the bus stop. They work together to match descriptive cards to distance-time graph cards and data table cards, all of which are provided for you so you can make copies for...
NASA
Resolving 3-Plane Traffic Conflicts by Changing Route—Problem Set C
Keep the planes from crashing. Pupils work with three airplanes and change their flight paths to keep them at a safe distance from each other. Individuals work through three problems in the third interactive in a set of six with...
NASA
Understanding the Effects of Differences in Speed—Problem Set D
Fall back and slow down. The fourth lesson in a six-part series on air traffic control leads the class to find the difference in distance traveled based upon the difference in speed. Pupils work through a problem related to walking...
NASA
Resolving 2-Plane Traffic Conflicts by Changing Speed—Problem Set E
What do you do to change arrival times of airplanes when a different route is not available? The fifth interactive in a series of six presents problems where pupils must find solutions to conflicts of safety rules. They must decide how...
EngageNY
Getting the Job Done—Speed, Work, and Measurement Units II
How fast is your class? Learners determine the amount of time it takes individuals to walk a given distance and calculate their speeds. Pupils solve distance, rate, and time problems using the formula and pay attention to the...
NASA
Resolving 3-Plane Traffic Conflicts by Changing Speed—Problem Set F
Get three planes to line up safely. Individuals work through a set of problems to eliminate spacing conflicts between three airplanes in flight. The pupils use their knowledge to change the airplanes' speed or route to meet a...
NASA
Resolving 2-Plane Traffic Conflicts by Changing Route—Problem Set B
Do pilots create appropriate spacing between aircraft by traveling a longer or shorter path? An interactive presents two airplanes that violate safety protocols. Pupils must determine how to change the path of one plane to create...
EngageNY
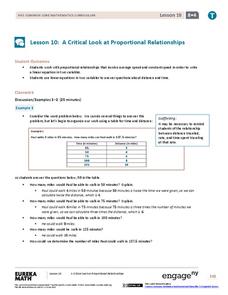
A Critical Look at Proportional Relationships
Use proportions to determine the travel distance in a given amount of time. The 10th installment in a series of 33 uses tables and descriptions to determine a person's constant speed. Using the constant speed, pupils write a linear...
National Wildlife Federation
Who Is Faster?
Am I going to catch it? Individuals time how long it takes them to walk, jog, and run a given distance and calculate their speed. They then research two animals and find their speeds. Using a chart, pupils compare the speeds of the...
Illustrative Mathematics
Velocity vs. Distance
At the end of this activity, your number crunchers will have a better understanding as to how to describe graphs of velocity versus time and distance versus time. It is easy for learners to misinterpret graphs of velocity, so have them...
Mathalicious
Been Caught Stealing
You're safe, when calculating the odds of stealing second base! Learners compare the rate of a runner to the distance the ball travels, in a lesson that explores right triangles and measurement. Full of discussion questions and fun...
Curated OER
Dragonfly
The speed of a dragonfly brings math into the real world as your learners collaboratively see the value in calculating unit rates in direct proportion problems. This six-phase lesson encourages you, as the teacher, to only ask questions...
Illustrative Mathematics
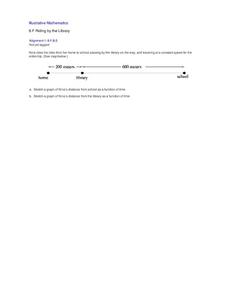
Riding by the Library
Draw a graph that shows the qualitative features of a function that has been described verbally. Make sure learners understand where time is zero and the distance is zero. It may take them some time to understand this concept, so working...
National Council of Teachers of Mathematics
Varying Motion
For this secondary mathematics learning exercise, high schoolers collect data based on a person’s motion. From this data, learners create graphs comparing displacement, velocity, and acceleration to time. The five-page learning exercise...
EngageNY
Constant Rates Revisited
Find the faster rate. The resource tasks the class to compare proportional relationships represented in different ways. Pupils find the slope of the proportional relationships to determine the constant rates. They then analyze the...


