Howard Hughes Medical Institute
Gorongosa: Scientific Inquiry and Data Analysis
How does the scientific process begin? Introduce ecology scholars to scientific inquiry through an insightful, data-driven lesson. Partners examine data from an ongoing research study to determine the questions it answers. The resource...
Curated OER
Drive the Data Derby
Three days of race car design and driving through the classroom while guessing probability could be a third graders dream. Learn to record car speed, distances traveled, and statistics by using calculation ranges using the mean, median,...
Radford University
Modeling Statistical Data
Can people predict the number of future divorces? Scholars research and analyze data on the number of divorces and teenage pregnancies in Virginia over time. They use the data to create graphs, determine the best-fit equations, and make...
Teach Engineering
Where Are the Plastics Near Me? (Mapping the Data)
The last activity in a nine-part series has teams create a Google Earth map using the data they collected during a field trip. Using the map, groups analyze the results and make adjustments to the map to reflect their analysis. A short...
Howard Hughes Medical Institute
Measuring Biodiversity in Gorongosa
Take your biology class' understanding of biodiversity to a whole new level! Ecology scholars use data to calculate three different diversity indices based on the organisms in the Gorongosa National Park. The four-part activity uses an...
National Council of Teachers of Mathematics
Eruptions: Old Faithful Geyser
How long do we have to wait? Given several days of times between eruptions of Old Faithful, learners create a graphical representation for two days. Groups combine their data to determine an appropriate wait time between eruptions.
Curated OER
Using Random Sampling to Draw Inferences
Emerging statisticians develop the ability to make inferences from sample data while also working on proportional relationships in general. Here, young learners examine samples for bias, and then use random samples to make...
EngageNY
Modeling a Context from Data (part 1)
While creating models from data, pupils make decisions about precision. Exercises are provided that require linear, quadratic, or exponential models based upon the desired precision.
National Security Agency
It's Probably Probable
Learners make predictions and draw conclusions from given information as they learn the meaning of probability in this vocabulary-rich, integrated activity that presents a variety of teaching strategies to motivate and reach...
Chicago Botanic Garden
Historical Climate Cycles
What better way to make predictions about future weather and climate patterns than with actual climate data from the past? Young climatologists analyze data from 400,000 to 10,000 years ago to determine if climate has changed over...
NASA
Erosion and Landslides
A professional-quality PowerPoint, which includes links to footage of actual landslides in action, opens this moving lesson. Viewers learn what conditions lead to erosion and land giving way. They simulate landslides with a variety of...
National Wildlife Federation
When It Rains It Pours More Drought and More Heavy Rainfall
Which is worse — drought or flooding? Neither is helpful to the environment, and both are increasing due to climate change. The 16th lesson plan in a series of 21 covers the average precipitation trends for two different climates within...
EngageNY
Modeling Relationships with a Line
What linear equation will fit this data, and how close is it? Through discussion and partner work, young mathematicians learn the procedure to determine a regression line in order to make predictions from the data.
101 Questions
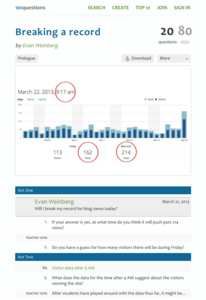
Breaking a Record
Can we break the record? Groups use provided data detailing the number of visitors to a blog to determine if the number of blog views breaks the previous record. They must take rates into consideration to make their estimates—a great...
Howard Hughes Medical Institute
Scientific Inquiry Using WildCam Gorongosa
How do scientists determine what questions to ask to meet their research goals? Help your class develop an inquiry mindset with a lesson based on studies in the Gorongosa National Park. Partners create their own research questions by...
NASA
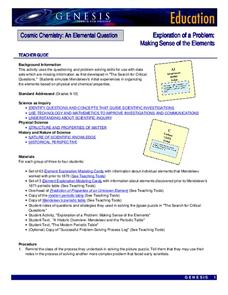
Exploration of a Problem: Making Sense of the Elements
When given too much data to simply memorize, it helps to sort it into manageable groups. The second lesson in the six-part series of Cosmic Chemistry challenges groups of pupils to take a large amount of data and figure out how to best...
Annenberg Foundation
Skeeters Are Overrunning the World
Skeeters are used to model linear and exponential population growth in a wonderfully organized lesson plan including teachers' and students' notes, an assignment, graphs, tables, and equations. Filled with constant deep-reaching...
EngageNY
Modeling a Context from Data (part 2)
Forgive me, I regress. Building upon previous modeling activities, the class examines models using the regression function on a graphing calculator. They use the modeling process to interpret the context and to make predictions...
Virginia Department of Education
Weather Patterns and Seasonal Changes
Get your class outside to observe their surroundings with a lesson highlighting weather patterns and seasonal changes. First, learners take a weather walk to survey how the weather affects animals, people, plants, and trees during...
Radford University
Snappy Stair Sprints
Let's go for a run. Small groups determine a way to collect data to determine the time it would take to run a set of stairs. After creating a plan, teams collect data and graph their results, calculating the equation of best fit and...
Education Development Center
Geography of the Coordinate Plane
Put the graph into graphing and allow learners to understand the concept of point plotting and how it relates to data. The worksheet provides a nice way to connect data analysis to a graph and make predictions. The worksheets within...
Radford University
Can I Create a Line/Curve of Best Fit to Model Water Drainage?
Learners collect data on the amount of water left in a bottle over time. They graph the data to determine whether the scatter plot shows a curved or straight relationship. Group members then determine an equation for the curve of best...
Center for Learning in Action
Introduction to the States of Matter
Liquids, gases, and solids are the states of matter in which scholars investigate in a lesson plan that offers in-depth information and engaging activities that look into the three states and the changes their properties make when mixed...
Virginia Department of Education
Curve of Best Fit
Which function models the data best? Pupils work through several activities to model data with a variety of functions. Individuals begin by reviewing the shapes of the functions and finding functions that will fit plotted data points. By...


