Curated OER
Drive the Data Derby
Three days of race car design and driving through the classroom while guessing probability could be a third graders dream. Learn to record car speed, distances traveled, and statistics by using calculation ranges using the mean, median,...
Curated OER
Remembering Our Veterans Data Management Project
Seventh graders utilize data collected from various sources based on Canadian military statistics to consolidate their understanding of data management. Students plan and create a PowerPoint presentation using this data including in...
Curated OER
Our Favourite Halloween Treat
Students conduct a survey about Halloween candy and create a bar graph illustrating the data. In this data analysis lesson, stud nets are introduced to the topic with a discussion and survey, then the class creates a large graph and...
Curated OER
Atlatl Lessons Grades 4-12: Lesson for Beginning Users of Atlatl
Sixth graders determine the mean, range median and mode of a set of numbers and display them. In this data lesson plan students form a set of data and use computer spreadsheet to display the information. They extend of the process by...
Curated OER
Who Has the Data? Monitoring Coral Reefs
Learners access data to characterize coral reefs. For this scientific research lesson, students access data and explain the need for such data when monitoring coral reefs. They will identify and explain three major threats to coral reefs.
Curated OER
Time Management
Students plot activities for a 24 hour day. They record their information on a spread sheet program. Students list categories they use and write equations for cells that add cells of each category together. Students create a pie chart of...
PBL Pathways
Maximizing Movie Revenue
Can theaters increase profits by raising or lowering ticket prices? Using data from the National Association of Theater Owners, classes consider this question. The project-based learning activity includes both a profit and revenue...
Curated OER
Bias in Statistics
Students work to develop surveys and collect data. They display the data using circle graphs, histograms, box and whisker plots, and scatter plots. Students use multimedia tools to develop a visual presentation to display their data.
Baylor College
HIV/AIDS in the United States
In the final of five lessons about HIV/AIDS, groups create presentations to share data about the infection rates in the United States, examining demographic and geographic trends over the past ten years. Depending on how much time you...
Curated OER
Tables, Charts and Graphs
Learners examine a science journal to develop an understanding of graphs in science. In this data analysis lesson, students read an article from the Natural Inquirer and discuss the meaning of the included graph. Learners create a...
Curated OER
Novel Character Study
Students complete a character study using a database to compile information from a novel. They design a five slide presentation highlighting the character's reaction to different situations in the book. They write an acrostic poem using...
Curated OER
Time Management
Students are taken through the design process to develop a system of time management for themselves and others. They practice participating in a critique of other students' time schedules and modify and improve their initial time...
Curated OER
It's My Time!
Students create a pie chart. In this time lesson, students determine the amount of time they spend on given activities. They create a pie chart diagraming the data. Students share their graphs with the class.
Curated OER
Destressing: Don't Sweat the Small Stuff
Students interview peers, teachers, counselors, parents and local health providers to see how they identify "good" stress and suggest teens cope, write news feature about stress, complete with extra boxes, such as list of signs to spots,...
Curated OER
Nutrition and Food Security
Examine the three basic nutrients and their effects on the body. Fifth graders will research data to construct a bar graph and then demonstrate the relationship between malnutrition and food security. This is a very comprehensive...
Intel
Composting: Why Bother?
The first STEM lesson in a group of 10 explores composting. After discussing how to make a better tomorrow, classes are challenged to track garbage in their communities, visit a local waste management facility, and conduct a survey about...
Curated OER
Boom and Bust
Students investigate commercial fishery. In this fishery lesson, students describe stages in commercial fishery, interpret data and predict when a fisher stock is showing signs of overexploitation.
California Academy of Science
Conservation Island
Why not walk in the footsteps of Teddy Roosevelt and become a conservationist? After discussing issues and reasons for animal extinction, the class creates their own conservation plans. Each small group is given mock data regarding a...
Curated OER
The New Haven Oyster Industry and Water Quality
Young scholars examine the different types of water pollutants and how they affect the waterways. In this environmental science lesson, students collect and interpret data from government agencies. They discuss how industrial development...
Curated OER
Project Management
Students, in project teams, demonstrate that they are able to successfully plan and manage a construction project. They meet with a customer, work as a team and complete the project to the customer's specifications.
Radford University
Budgeting Your Time and Money
Use mathematics to better manage money. Pupils learn about budgets and personal finance with a set of three lessons. They research salary data for their chosen careers, look up various costs of living to develop budgets, and plan an...
Curated OER
What's For Dinner?
Eighth graders discover how the location of restaurants affects the future location of different restaurants. Using a fictionous town, they map the locations of all current restaurants and analyze the data to determine what type of...
Curated OER
IT IS ABOUT SUPPLY AND DEMAND.
Students learn that the price of an item is defined by its supply and demand. In this lesson students graph the relationship between demand and supply of various products, students also consider hidden costs.
Achieve
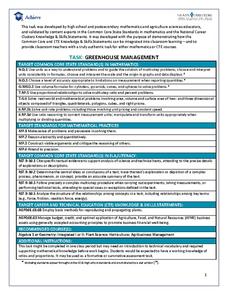
Greenhouse Management
Who knew running a greenhouse required so much math? Amaze future mathematicians and farmers with the amount of unit conversions, ratio and proportional reasoning, and geometric applications involved by having them complete the...
Other popular searches
- Measurement Data Management
- Data Management Story
- Math and Data Management
- Math Lesson Data Management
- Data Management and Graphing
- Data Management Computing
- Data Management Analysis
- Data Management Math
- Data Management Lesson Plan
- Data Management Math Lessons
- Data Base Management Systems
- Business Data Management


