Curated OER
Interpreting Graphs
Sixth graders interpret linear and nonlinear graphs. They create graphs based on a problem set. Next, they represent quantitive relationships on a graph and write a story related to graphing.
EngageNY
Graphing Solutions to Inequalities
Activate the strengths of your visual learners using an informative instructional activity. In the 15th installment of the series of 28, pupils graph their solutions on number lines to create a visual representation of solutions....
EngageNY
Equations of Graphs of Proportional Relationships Involving Fractions
The 15th segment in a series of 22 uses examples that present proportional relationships with fractions. Pupils work through the problems and discover that the process is the same as it is with whole number values. Graphing the...
Curated OER
Spaghetti Graphs
Students work in pairs to test the strength of spaghetti strands. They collect and graph data to determine a line of best fit. Students create a linear equation to interpret their data. Based on the data collected, students predict...
Curated OER
Build A Skittles Graph
Students explore graphing. In this graphing activity, students sort Skittles candies and use the color groups to create a bar graph. Rubrics and extension activities are provided.
Illustrative Mathematics
Bike Race
A graph not only tells us who won the bike race, but also what happened during the race. Use this resource to help learners understand graphs. The commentary suggests waiting until the end of the year to introduce this topic, but why...
Curated OER
Walk-A-Thon
Students graph linear http://www.lessonplanet.com/review?id=180542equations. In this problem solving lesson, students calculate slope and plot ordered pairs on a coordinate grid. Using a real-life example of a walk-a-thon, students...
Agile Mind
Transforming Graphs of Quadratic Functions
In the activity on this webpage, learners use interactive graphing technology to investigate transformations of graphs. In the first part of the task, they look at the graph of a quadratic function with coordinates of a few points...
Curated OER
Describing Data
Your learners will practice many ways of describing data using coordinate algebra in this unit written to address many Common Core State Standards. Simple examples of different ways to organize data are shared and then practice problems...
EngageNY
Modeling a Context from a Verbal Description (part 1)
When complicated algebraic expressions are involved, it is sometimes easier to use a table or graph to model a context. The exercises in this lesson are designed for business applications and require complex algebraic...
EngageNY
Modeling a Context from Data (part 2)
Forgive me, I regress. Building upon previous modeling activities, the class examines models using the regression function on a graphing calculator. They use the modeling process to interpret the context and to make predictions...
Illustrative Mathematics
Writing Constraints
Use this resource to present your number crunchers with how to write a constraint equation and to determine viable solutions. The price of an object limits the amount that can be purchased. The speed at which you walk limits the number...
Illustrative Mathematics
Summer Swimming
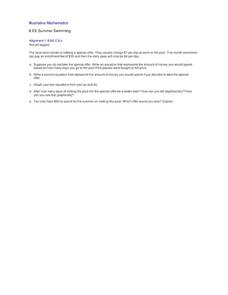
Here is a real-world application for systems of equations. When is it better to pay an enrollment fee and lower daily rate, and when is it better to pay the regular price? The local swim center is having a special offer, reductions in...
Curated OER
The Canoe Trip, Variation 1
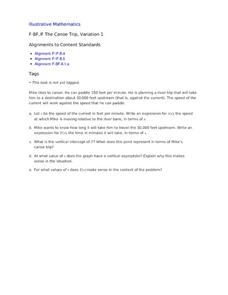
Your river sportsmen will explore an example of paddling upstream as they build functions modeling speed and time in terms of the speed of the current. They then use their algebraic models to interpret features of the function related to...
Illustrative Mathematics
Peaches and Plums
According to the resource graph, which costs more: peaches or plums? Algebra learners compare two proportional relationships and then throw in a banana. Leaving out the scale helps students become intuitive about graphing.
National Security Agency
What’s Your Coordinate?
Your middle schoolers will show what they know with their bodies when they become the coordinate plane in this conceptual development unit. Starting with the characteristics of the coordinate plane, learners develop their skills by...
Illustrative Mathematics
Fishing Adventures 2
This resource is part of a series which expects participants to be familiar with graphing inequalities on a number line. It is a word problem that asks your class to graph a discrete solution set and interpret it in the context of an...
Virginia Department of Education
Analyzing and Interpreting Statistics
Use measures of variance to compare and analyze data sets. Pupils match histograms of data sets to their respective statistical measures. They then use calculated statistics to further analyze groups of data and use the results to make...
Curated OER
Money Circulation: A Story of Trade and Commerce
Students are introduced to the meaning, symbolism, and value of the quarter. They determine the percentage of total monetary value held in quarters and graph the results. Students infer about the U.S. Mint's distrubution of coins. They...
EngageNY
Modeling a Context from a Verbal Description (part 2)
I got a different answer, are they both correct? While working through modeling problems interpreting graphs, the question of precision is brought into the discussion. Problems are presented in which a precise answer is needed and...
Illustrative Mathematics
Throwing Baseballs
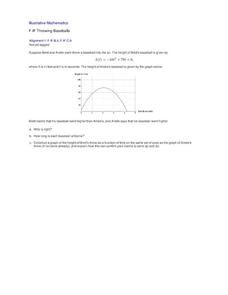
This is a wonderful exercise for learners to apply their critical thinking skills along with their knowledge of quadratic functions and parabolas. Young mathematicians investigate a real-world scenario about the height a baseball reaches...
Curated OER
Exponential Functions
Your algebra learners analyze and interpret the general form and the graph of two functions. The increase of the function due to the multiplicative factor is emphasized.
Curated OER
Geometric Sequences - Bacterial Growth
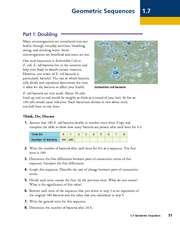
Bring algebra to life with scientific applications. Math minded individuals calculate and graph the time it takes a bacterium to double. They discuss geometric sequences and use a chart to graph their findings. There are 38...
EduGAINs
Introduction to Solving Linear Systems
Word problems offer class members an opportunity to learn the concept of solving linear systems using graphs. Individuals choose a problem based upon preferences, break into groups to discuss solution methods and whether there...


