University of Colorado
Looking Inside Planets
Researchers use scientific data to understand what is inside each of the planets. The first in a series of six, this lesson builds off of that concept by having pupils use a data table to create their own scale models of the interiors of...
Bonneville
Creating the Most Effective Solar Heater
If changing one variable can improve a design, why not try changing more? Using the results from the previous activity, scholars decide on the variables that caused the most improvement in the effectiveness of the solar heater. They take...
Curated OER
Build A Skittles Graph
Students explore graphing. In this graphing lesson, students sort Skittles candies and use the color groups to create a bar graph. Rubrics and extension activities are provided.
EngageNY
Conditional Relative Frequencies and Association
It is all relative, or is it all conditional? Using an exploration method, the class determines whether there is an association between gender and superpower wish through the use of calculating conditional relative frequencies. The last...
Virginia Department of Education
Growing Patterns and Sequences
Learners explore, discover, compare, and contrast arithmetic and geometric sequences in this collaborative, hands-on activity. They build and analyze growing patterns to distinguish which kind of sequence is represented by a set of data...
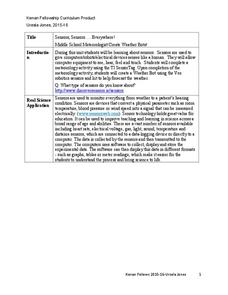
Kenan Fellows
Sensors, Sensors…..Everywhere! Middle School Meteorologist Create Weather Bots!
My forecast is that you'll want to use the resource. Pupils design and create a weather bot as part of a project-based unit. These bots should be able to measure temperature, humidity, barometric pressure, wind speed and direction, and...
Curated OER
Effects of Temperature, Deviation on Climate
Students collect and record data for a given city. They calculate standard deviation of temperature and analyze the impact of climate changes on a city's and culture.
Towson University
Mystery of the Crooked Cell
Can your class solve the Mystery of the Crooked Cell? Junior geneticists collaborate to learn about sickle cell anemia in a fascinating lesson plan. The included materials help them to examine the genetic factors behind the disease...
Virginia Department of Education
Quadratic Curve of Best Fit
Class members create a table of the number of chords that can be drawn given the number of points on a circle. Pupils analyze the data created, find a function to fit to it, and use the function to make further predictions.
EngageNY
Relationships Between Two Numerical Variables
Is there another way to view whether the data is linear or not? Class members work alone and in pairs to create scatter plots in order to determine whether there is a linear pattern or not. The exit ticket provides a quick way to...
Museum of Tolerance
Where Do Our Families Come From?
After a grand conversation about immigration to the United States, scholars interview a family member to learn about their journey to America. They then take their new-found knowledge and apply their findings to tracking their family...
Kid Zone
Groundhog's Day Graphing
This Groundhog's Day, challenge scholars to predict, estimate, tally, and graph in a weather-themed lesson in which class members play the role of the groundhog to forecast the weather come February second.
Curated OER
How Do Clouds Affect Radiative Energy
Students graph the upwelling and downwelling of shortwave radiation. They create a data table with the information. Students compute the Watts per square meter. They discuss their results and whether or not cloud type affects daily...
EngageNY
More on Modeling Relationships with a Line
How do you create a residual plot? Work as a class and in small groups through the activity in order to learn how to build a residual plot. The activity builds upon previous learning on calculating residuals and serves as a precursor to...
Curated OER
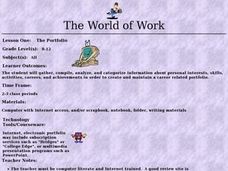
The World of Work: The Portfolio
Students compile information to include in their career portfolio. For this portfolio lesson, students view example portfolios using the given website and identify the portfolio components. Students gather and compile artifacts for their...
NOAA
What Killed the Seeds?
Can a coral cure cancer? Take seventh and eighth grade science sleuths to the underwater drugstore for an investigation into emerging pharmaceutical research. The fifth installment in a series of six has classmates research the wealth of...
Curated OER
T's Alive! Or Is It?
Students explore data on the bone, muscle, and skin of living systems and then create a list of characteristics of these systems and relate these characteristics to bone, muscle, and skin.
Curated OER
1928 Flu
Students state the some diseases are the result of infection. They describe the risks associated with biological hazards, such as viruses. Pupils name ways that infectious disease can be prevented, controlled, or cured. Students...
Curated OER
Making Money and Spreading the Flu!
Paper folding, flu spreading in a school, bacteria growth, and continuously compounded interest all provide excellent models to study exponential functions. This is a comprehensive resource that looks at many different aspects of these...
PwC Financial Literacy
Income and Careers: Career Exploration
Elementary schoolers take part in a virtual career day and are exposed to various career opportunities in the finance, education, and medical fields. By accessing a video you can download from the PwC Financial website, learners "shadow"...
Laboratory for Atmospheric and Space Physics
Planetary Distances on the Playground
There's no need to stay inside; get out of the classroom and create a scaled map of the solar system on your playground field! In collaborative groups, scholars identify the distance between the sun and other planets, place planet...
Curated OER
What are the Issues?
Seventh graders complete political analysis activities. In this political analysis lesson, 7th graders discuss party platforms and research party issues for their party's candidate's positions. Students complete an issues organizer and...
Curated OER
Kansas Foods A Data and Probability Investigation
Students study a number of food products and anticipate which are derived from Kansas crops. They make a list of words associated with the food stuffs and graph the results.
Curated OER
Interpreting Graphs
Sixth graders interpret linear and nonlinear graphs. They create graphs based on a problem set. Next, they represent quantitive relationships on a graph and write a story related to graphing.


