EngageNY
The Graph of a Linear Equation—Horizontal and Vertical Lines
Graph linear equations in standard form with one coefficient equal to zero. The lesson plan reviews graphing lines in standard form and moves to having y-coefficient zero. Pupils determine the orientation of the line and, through a...
EngageNY
The Slope of a Non-Vertical Line
This lesson introduces the idea of slope and defines it as a numerical measurement of the steepness of a line. Pupils then use the definition to compare lines, find positive and negative slopes, and notice their definition holds for...
Curated OER
Discovering Art - Scott Gallery: Line
Students study how line is used in art. They identify horizontal, vertical, and diagonal lines in artwork. They view the painting, The Western Brothers, and identify the line the dog makes and the position of the boy's arm. They discuss...
EngageNY
Understanding Addition of Integers
Count up or down to find sums. The third instructional activity in a 25-part series uses number lines to build an understanding of the sums of integers. Pupils make the connection between the distance and direction of a sum from the...
New Mexico State University
Number Rights
You do not have to be whole to be important. Individuals watch a video on the importance of rational numbers on the number line. Scholars use their knowledge to rename numbers on the number line as well as place rationals on a number...
PBS
Adding Integers
Your sixth and seventh graders deepen their understanding of a number line and adding integers in this concrete, hands-on activity. Learners play "Warehouse Puzzle" and then discuss their game strategies and the characteristics...
02 x 02 Worksheets
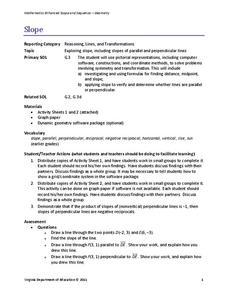
Slope
What does slope have to do with lines? Pupils work with lines and determine the slope of the lines informally and with the slope formula. Groups use their knowledge to calculate the slopes of parallel and perpendicular lines. They also...
Curated OER
Learn How to Graph
Learners examine various types of charts and discover how to construct a line graph. Using graph paper, they construct a graph displaying weight loss over a five-year period. They draw copnclusions from the completed graphs.
West Contra Costa Unified School District
Conics Introduction and Parabolas
Where did conic sections get their name? The equation and graph of a parabola are developed from the definition of the conic section. Teacher examples on graphing the equation and writing an equation from the graph round out the plan.
Terry Kawas
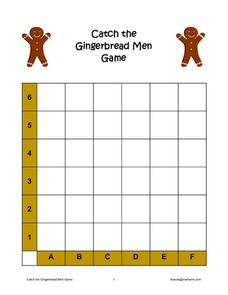
Catch the Gingerbread Men Game
Catching men made of gingerbread motivates your young graphers to begin exploring the concept of finding a point in two-dimensional space. Learners practice locating each cookie by rolling two cubes (one with...
Curated OER
Linking Lines to Landscape
Students evaluate art to enhance their core knowledge of fiction, American folk heroes, and the water cycle. In this art lesson, students complete a unit of activities to use art to study various topics of literature, history, and...
Curated OER
"Graph It"
Young scholars work in teams to conduct short surveys of their classmates. They show their results using at least two different types of graphs.
Students separate into teams and are asked that each team to choose something that they are...
EngageNY
Efficiently Adding Integers and Other Rational Numbers
Develop the rules for adding rational numbers. Pupils continue to work on adding integers. Young mathematicians use their experiences to develop the rules for adding integers with like and unlike signs. They finish the lesson plan by...
Curated OER
Latitude/Longitude Activity
Youngsters work in groups to solve clues involving latitude and longitude coordinates in order to decipher mystery animals in this fun learning experience!
Curated OER
MONET'S GARDEN BY THE SEA
Students establish their own design utilizing a similar composition to Monet's, integrate their drawing skills in creating a "garden by the sea."
Illustrative Mathematics
Introduction to Linear Functions
Introduce your algebra learners to linear and quadratic functions. Learners compare the differences and relate them back to the equations and graphs. Lead your class to discussions on the properties of a function or a constant slope...
Illustrative Mathematics
Running on the Football Field
Make your class into Pythagorean theorem fanatics in no time. What a great resource to get your sports enthusiasts into the math game! Read the commentary so you can you can strategize how to apply the three math practices.
Yummy Math
Steep Hikes
Grab your hiking gear and get ready for a math adventure! Learners explore the meaning of percent grade change, as compared to the slope in an excellent worksheet activity about hiking trails in the mountains of New Hampshire. They...
Brooklyn Museum
"Workt by Hand": Hidden Labor and Historical Quilts
Just like a painting or the symbols on a flag, quilts can express ideas that reflect a cultural context, space, and time. The class discusses the history of quilt making throughout US history and what different types of quilts mean. They...
Curated OER
Sea Turtles Underwater
Students discuss different types of sea turtles. They talk a about the characteristics of sea turtle anatomy. Students pretend to look over the edge of a boat in the ocean. They pretend to see a sea turtle. Students create their artwork...
Curated OER
Exploring Aerodynamics
Students explore aerodynamics. In this aerodynamics lesson, students study the flight patterns of three paper airplanes and discover the underlying principles of aerodynamics. Resources and grade level modifications are present.
Curated OER
Coordinate Grid: Mapping an Archaeological Site
Middle schoolers examine how archaeologists preserve context of sites through use of rectangular grid or Cartesian coordinate system, and develop sense of distance by pacing off and estimating distances.
Curated OER
Olympic records through time
Students compare the records of gold medal Olympic winners for the last 100 years and decide if we are faster, stronger than in the past.


