National Security Agency
Line Plots: Frogs in Flight
Have a hopping good time teaching your class how to collect and graph data with this fun activity-based instructional activity series. Using the provided data taken from a frog jumping contest, children first work together creating a...
PBS
Button, Button
Youngsters count, classify, and estimate quantities using buttons after a read aloud of The Button Box by Margarette S. Reid. They discuss the difference between guessing and estimating. Based on an experiment, they predict the number of...
Curated OER
Flicking Football Fun
Young mathematicians fold and flick their way to a deeper understanding of statistics with a fun, hands-on math unit. Over the course of four lessons, students use paper footballs to generate data as they learn how to create line...
EngageNY
More on Modeling Relationships with a Line
How do you create a residual plot? Work as a class and in small groups through the activity in order to learn how to build a residual plot. The activity builds upon previous learning on calculating residuals and serves as a precursor to...
Curated OER
After Reading: "Plot the Plot" Activity in the Library Media Class
"Plot the plot" of "The Adventures of the Speckled Band" with your young readers. Take a few days to read Sir Arthur Conan Doyle's short story as a class or in pairs, having learners write down what they consider to be the most important...
EngageNY
Creating a Dot Plot
Which dot am I? Pupils create dot plots to represent sample data through the use of frequency tables. The third segment in a series of 22 asks individuals to analyze the dot plots they created. The scholars translate back and forth...
EngageNY
Modeling Relationships with a Line
What linear equation will fit this data, and how close is it? Through discussion and partner work, young mathematicians learn the procedure to determine a regression line in order to make predictions from the data.
EngageNY
Interpreting Residuals from a Line
What does an animal's gestation period have to do with its longevity? Use residuals to determine the prediction errors based upon a least-square regression line. This second lesson on residuals shows how to use residuals to create a...
University of Colorado
Graphing the Rainbow
Here's a colorful resource about spectra. An intriguing instructional activity teaches pupils about diffraction grating and about absorption and emission spectra. They see how to represent spectra using line plots and try out this skill...
EngageNY
From Ratio Tables, Equations and Double Number Line Diagrams to Plots on the Coordinate Plane
Represent ratios using a variety of methods. Classmates combine the representations of ratios previously learned with the coordinate plane. Using ratio tables, equations, double number lines, and ordered pairs to represent...
Illustrative Mathematics
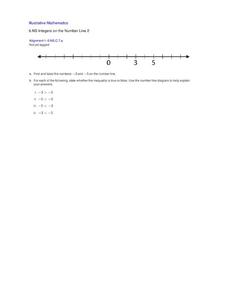
Integers on the Number Line 2
Four inequality statements are given for the same two negative numbers. The resource is a good practice for pupils to interpret statements of inequalities relative to the position on the number line. The objective is for pupils to learn...
PBS
Plotting Pairs of Coordinate Points in all Four Quadrants to Construct Lines
Here is a lesson on coordinates that has pupils view three Cyberchase video clips illustrating the definition of "point" and "line." Along the way, learners will discuss what characters from the videos do, and where problems lie in their...
Mathematics Vision Project
Modeling Data
Is there a better way to display data to analyze it? Pupils represent data in a variety of ways using number lines, coordinate graphs, and tables. They determine that certain displays work with different types of data and use two-way...
Curated OER
Scatter-Brained
Seventh graders graph ordered pairs on a coordinate plane. They create a scatterplot. Additionally, they determine the line of best fit and investigate the slope of the line. Multiple resources are provided. An excellent resource!
Project Maths
Correlation Coefficient
Of course, there might be a correlation! Young mathematicians investigate several different data sets, create scatter plots, and determine any correlation. They consider whether a causation exists between any of the variables in question.
Curated OER
Exploring Linear Equations And Scatter Plots - Chapter 5 Review
Students complete rolling stocks experiment, and collect and enter data on the computer. They enter data on graphing calculators, complete scatter plot by hand with line of best fit, and discuss different graphing methods.
PBS
Plotting Pairs of Coordinate Points in All Four Quadrants to Construct Lines
Your young graphers are motivated by watching three Cyberchase videos to plot points in all four quadrants, connect pairs of points to make a line segment, and find the point of intersection of two lines.
Illustrative Mathematics
Irrational Numbers on the Number Line
There are four irrational numbers that participants need to graph. Pi(π), -(½ x π), and √17 are easy to approximate with common rational numbers. On the other hand, the commentary describing the irrational number 2√2 is not clear. It...
American Statistical Association
Scatter It! (Predict Billy’s Height)
How do doctors predict a child's future height? Scholars use one case study to determine the height of a child two years into the future. They graph the given data, determine the line of best fit, and use that to estimate the height in...
Curated OER
Button Bonanza
Collections of data represented in stem and leaf plots are organized by young statisticians as they embark some math engaging activities.
American Statistical Association
EllipSeeIt: Visualizing Strength and Direction of Correlation
Seeing is believing. Given several bivariate data sets, learners make scatter plots using the online SeeIt program to visualize the correlation. To get a more complete picture of the topic, they research their own data set and perform an...
California Academy of Science
California's Climate
The United States is a large country with many different climates. Graph and analyze temperature and rainfall data for Sacramento and Washington DC as you teach your class about the characteristics of Mediterranean climates. Discuss the...
Curated OER
Walk-A-Thon
Students graph linear http://www.lessonplanet.com/review?id=180542equations. In this problem solving lesson, students calculate slope and plot ordered pairs on a coordinate grid. Using a real-life example of a walk-a-thon, students...
Curated OER
Creating Scrolls Based on the Illustrated Tale of Genji
Now these are learning activities full of fun, art, and cultural exploration. Kids consider the art of storytelling through comic book images. They then look at the Tale of Genji as it was written in the 11th century. They discuss...
Other popular searches
- Frequency Tables Line Plots
- Line Plots Grade 3
- Math Line Plots
- Christmas Line Plots
- Line Plots and Tallies
- Activities Using Line Plots
- Data Analysis Line Plots
- Human Line Plots
- Ell Math Line Plots
- Line Plots With Airplanes
- Charts, Tables, Line Plots
- Charts Tables Line Plots


