Curated OER
Graphing Stories Ice Breaker
Kick off the school year with some math fun! New classmates share information about themselves by using graphs and interpreting data. The goal is to use a general graph shape, such as linear or exponential, and create labels for the axes...
EngageNY
Tax, Commissions, Fees, and Other Real-World Percent Problems
Pupils work several real-world problems that use percents in the 11th portion of a 20-part series. The problems contain percents involved with taxes, commissions, discounts, tips, fees, and interest. Scholars use the equations formed for...
National Security Agency
Partying with Proportions and Percents
Examine ratios and proportions in several real-world scenarios. Children will calculate unit rates, work with proportions and percentages as they plan a party, purchase produce, and take a tally. This lesson plan recommends five...
EngageNY
Graphing Solutions to Inequalities
Activate the strengths of your visual learners using an informative instructional activity. In the 15th installment of the series of 28, pupils graph their solutions on number lines to create a visual representation of solutions....
Missouri Department of Elementary
Opportunity Knocks, But It Costs, Too!
Sixth graders practice six steps to effective problem solving. Working with the school counselor, class members are presented with a scenario that requires them to make a decision. Individuals then write a reflection in which they...
Missouri Department of Elementary
STAR Deputies, Unite!
STAR deputies unite! Scholars gather in small groups to solve problems using the STAR method. Pupils read a card that describes a situation that requires problem-solving. They role-play the scenario in front of their peers.
EngageNY
Another Computational Model of Solving a Linear System
The process of elimination really works! Use elimination when substitution isn't doing the job. The 29th segment in a series of 33 introduces the elimination method to solving linear systems. Pupils work several exercises to grasp the...
Mathematics Assessment Project
Representing Quadratic Functions Graphically
Sometimes being different is an advantage. An engaging activity has scholars match cards with quadratic functions in various forms. Along the way, they learn about how each form highlights key features of quadratic functions.
EngageNY
Markup and Markdown Problems
There is a 100 percent chance this resource will help pupils connect percents to financial literacy. Young mathematicians use their knowledge of percents to find markups and markdowns in financial situations in the seventh segment in a...
EduGAINs
Introduction to Solving Linear Systems
Word problems offer class members an opportunity to learn the concept of solving linear systems using graphs. Individuals choose a problem based upon preferences, break into groups to discuss solution methods and whether there...
Mathematics Vision Project
Systems of Equations and Inequalities
It's raining (systems of) cats and dogs! The fifth unit in a nine-part course presents systems of equations and inequalities within the context of pets. Scholars use systems of inequalities to represent constraints within situations...
EngageNY
Nature of Solutions of a System of Linear Equations
If at first you cannot graph, substitute. The lesson introduces the substitution method as a way to solve linear systems if the point of intersection is hard to determine from a graph. The 28th installment of a 33-part series finishes...
Teach Engineering
The Energy Problem
Think you can solve the energy problem? You'll first need to know about current energy use. Analyzing a set of circle graphs lets scholars see where energy consumption is the greatest, both by sector and by household use. They develop a...
EngageNY
Characteristics of Parallel Lines
Systems of parallel lines have no solution. Pupils work examples to discover that lines with the same slope and different y-intercepts are parallel. The 27th segment of 33 uses this discovery to develop a proof, and the class determines...
Curated OER
Model and Solve Algebraic Equations
Examine multiple ways to solve algebraic equations. Pupils will generate a problem solving strategy that addresses the prompt given by the teacher. They will then share their problem solving strategy with the class. Graphic organizers,...
Sinclair Community College
Solving Linear Inequalities
Your learners will appreciate the complete picture of linear inequalities presented in this lesson plan. Starting simply with definitions and moving all the way to solving linear inequality word problems this activity is simple to...
EngageNY
Mathematical Area Problems
Teach the connection between area models and the distributive property through problem-solving. The 22nd activity in a series of 29 explains the distributive property graphically. Learners build area models from word problems and convert...
EngageNY
Finding One Hundred Percent Given Another Percent
Class members solve problems to find the whole when given a percent. They use double line numbers and factors of hundred to help break the 100 percent into equal segments.
Missouri Department of Elementary
Dealing with Peer Influence: What Are Bullying and Harassment?
Scholars examine examples of peer pressure and discuss how specific actions negatively affect one's well-being. Learners gather in small groups to write two scenarios in which peer pressure is used. They reference the STAR method in how...
EngageNY
From Ratio Tables, Equations and Double Number Line Diagrams to Plots on the Coordinate Plane
Represent ratios using a variety of methods. Classmates combine the representations of ratios previously learned with the coordinate plane. Using ratio tables, equations, double number lines, and ordered pairs to represent...
Open Text Book Store
Arithmetic for College Students: Worksheets
Loaded with concepts ranging from multiplying decimals to converting units to solving problems using the order of operations, a thorough practice packet is perfect for a fifth or sixth grade math classroom.
Curated OER
Describing Data
Your learners will practice many ways of describing data using coordinate algebra in this unit written to address many Common Core State Standards. Simple examples of different ways to organize data are shared and then practice problems...
Curated OER
Build A Skittles Graph
Students explore graphing. In this graphing lesson, students sort Skittles candies and use the color groups to create a bar graph. Rubrics and extension activities are provided.
CK-12 Foundation
Comparison of Unit Rates: Drive Away
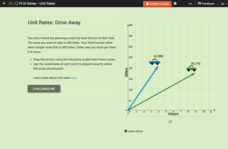
Five questions make up an interactive that challenges mathematicians to compare unit rates. Word problems question scholars about two friends going on a road trip. Scholars manipulate two cars on a coordinate plane to help solve word...


