EngageNY
Summarizing Bivariate Categorical Data in a Two-Way Table
Be sure to look both ways when making a two-way table. In the lesson plan, scholars learn to create two-way tables to display bivariate data. They calculate relative frequencies to answer questions of interest in the 14th part of the...
Curated OER
Describing Data
Your learners will practice many ways of describing data using coordinate algebra in this unit written to address many Common Core State Standards. Simple examples of different ways to organize data are shared and then practice problems...
American Statistical Association
Candy Judging
Determine the class favorite. The statistics lesson plan has pupils collect, display, and analyze data. Pairs rank four kinds of candy based on their individual preferences. Working as an entire class, learners determine a way to display...
Corbett Maths
The Mode
Most frequently prefer the mode. The resource defines the mode and shows how to determine it in a data set. Using another type of problem, the video develops a data set with a given mode and number of data points.
EngageNY
Association Between Categorical Variables
Investigate associations between variables with two-way tables. Scholars continue their study of two-way tables and categorical variables in the 15th installment of a 21-part module. The lesson challenges them to calculate relative...
Willow Tree
Histograms and Venn Diagrams
There are many different options for graphing data, which can be overwhelming even for experienced mathematcians. This time, the focus is on histograms and Venn diagrams that highlight the frequency of a range of data and overlap of...
Curated OER
Using Random Sampling to Draw Inferences
Emerging statisticians develop the ability to make inferences from sample data while also working on proportional relationships in general. Here, young learners examine samples for bias, and then use random samples to make...
Mathed Up!
Two Way Tables
When presented with categorical data, a two-way frequency table is a great way to summarize the information. Pupils organize categorical data using a two-way table, then use the tables to determine missing data and to calculate simple...
Las Cumbres Observatory
Create a Hubble Tuning Fork Diagram
Add a little color to the universe. Learners recreate images of the galaxies using real data and Photoshop software. They display their images in a Hubble tuning fork diagram by classifying and categorizing their shapes.
State of Michigan
Pre-K Mathematics
Kick-start children's education with this pre-school math unit. Offering 31 different hands-on learning activities that develop young mathematicians' pattern and shape recognition, basic number sense, and much more, this is a...
Curated OER
Identifying Economic Systems
Young historians practice identifying evidence to categorize a particular country's economic system as either a mixed, centrally planned, traditional, or free economic system in this two-part lesson.
We are Teachers
What Goes Up Must Come Down
From understanding stock market performance and return on investment to identifying the costs and benefits of credit and avoiding debt problems, this is an absolute must-have resource for financial planning and literacy.
NOAA
Tides
Low tides, high tides, spring tides, neap tides, diurnal tides, semidiurnal tides, mixed tides ... just how many types of tides are there? The 10th installment of a 23-part NOAA Enrichment in Marine sciences and Oceanography (NEMO)...
Visa
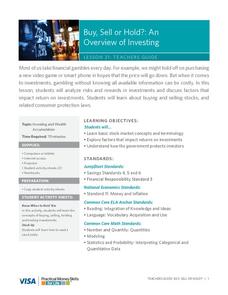
Buy, Sell or Hold?: An Overview of Investing
Break down the often-daunting topic of the stock market with this resource, in which pupils learn basic terminology regarding buying and selling stocks, as well as the factors that influence how much return individuals can receive...
Visa
A Way to Wealth: Understanding Interest and Investments
Money motivates! Help young bankers understand how math plays a part in investing. Give learners math practice while instilling real-world financial literacy skills.
Core Knowledge Foundation
Greek And Latin Root Words
Students examine Greek and Latin root words. They research the history of the English language, solve word games and puzzles, write paragraphs about the impact of Greek and Latin on the English language, and create flip chart study guides.
Other popular searches
- Categorical Data Worksheet
- Classify Categorical Data
- Numerical vs. Categorical Data
- Numerical vs Categorical Data


