Council for Economic Education
GDP Data: Is the Economy Healthy?
Does the economy needs a check-up? Scholars analyze the gross domestic product (GDP) to determine the overall health of the current economy. They use a short video clip as well as economic data to determine the current growth of the...
Berkshire Museum
Camouflage!: Collecting Data and Concealing Color
Help young scholars see the important role camouflage plays in the survival of animals with a fun science lesson. Starting with an outdoor activity, children take on the role of hungry birds as they search for worms represented by...
Virginia Department of Education
May I Have Fries with That?
Not all pie graphs are about pies. The class conducts a survey on favorite fast food categories in a lesson on data representation. Pupils use the results to create a circle graph.
American Institutes for Research
Digital Smiles
Explore metric measurement, recording data, and creating an electronic spreadsheet displaying results with your math class. Scholars will measure the length of their smiles, record the measurements, and represent the results on an...
NASA
The Types of Clouds and What They Mean
Learn to forecast the weather using cloud types. Budding meteorologists identify cloud types and learn to use a dichotomous key. As scholars develop observation and identification skills, they discover how different cloud types cause...
Willow Tree
Circle Graphs
Pie isn't just for eating! Scholars learn to create pie charts and circle graphs to represent data. Given raw data, learners determine the percent of the whole for each category and then figure out the degree of the circle that percent...
Museum of Tolerance
Why is This True?
Are wages based on race? On gender? Class members research wages for workers according to race and gender, create graphs and charts of their data, and compute differences by percentages. They then share their findings with adults and...
Willow Tree
Histograms and Venn Diagrams
There are many different options for graphing data, which can be overwhelming even for experienced mathematcians. This time, the focus is on histograms and Venn diagrams that highlight the frequency of a range of data and overlap of...
National Security Agency
Starting a Restaurant
Through an engaging unit, chefs-in-training will sort and classify data using tally charts. Learners will also create bar graphs to display restaurant data and interpret data from bar graphs using a variety of categories....
Newspaper Association of America
By the Numbers: Mathematical Connections in Newspapers for Middle-Grade Students
A cross-curricular resource teaches and reinforces mathematical concepts with several activities that use parts of a newspaper. Scholars use scavenger hunts to find the different ways math is used in the paper along with using data...
Anti-Defamation League
The Gender Wage Gap
"Equal pay for equal work!" may sound logical but it is not the reality. High schoolers begin a study of the gender wage gap with an activity that asks them to position themselves along a line that indicates whether they strongly agree...
Curated OER
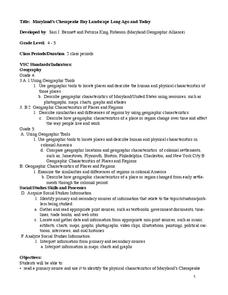
Maryland’s Chesapeake Bay Landscape Long Ago and Today
Combine a fantastic review of primary source analysis with a study of Captain John Smith's influence on the Chesapeake Bay region in the seventeenth century. Your young historians will use images, a primary source excerpt, and maps...
State of Michigan
Pre-K Mathematics
Kick-start children's education with this pre-school math unit. Offering 31 different hands-on learning activities that develop young mathematicians' pattern and shape recognition, basic number sense, and much more, this is a...
Center for Learning in Action
Density
Explore the concept of density within states of matter—gases, liquids, and solids—through a group experiment in which young scientists test objects' texture, color, weight, size, and ability to sink or float.
Curated OER
Texas Commemorative Maps: Honoring Our Past
To celebrate Texas, groups plan and create a commemorative map for a topic or theme in Texas history. The richly detailed plan and the approach could easily be adapted to any state. Samples are included.
Center for Learning in Action
Properties of Balls
Enhance your states of matter lessons with a hands-on science investigation that compares six different balls' color, texture, size, weight, ability to bounce, and buoyancy.
Center for Learning in Action
Water – Changing States (Part 2)
Here is part two of a two-part lesson in which scholars investigate the changing states of water—liquid, solid, and gas—and how energy from heat changes its molecules. With grand conversation, two demonstrations, and one hands-on...
Center for Learning in Action
Investigating Physical and Chemical Changes
Super scientists visit ten stations to predict, observe, and draw conclusions about the physical and chemical changes that occur when different states of matter—liquid, solid, and gas—are placed under a variety of conditions. To...


