EngageNY
Graphs of Simple Nonlinear Functions
Time to move on to nonlinear functions. Scholars create input/output tables and use these to graph simple nonlinear functions. They calculate rates of change to distinguish between linear and nonlinear functions.
CK-12 Foundation
Function Rules for Input-Output Tables: Soda Sugar Function Table
Examine the relationship between the input and output variables in a table of values. As learners build an input-output table using online manipulatives, they begin to identify patterns. They answer questions about these patterns...
Charleston School District
Graphing Functions
How do letters and numbers create a picture? Scholars learn to create input/output tables to graph functions. They graph both linear and nonlinear functions by creating tables and plotting points.
CK-12 Foundation
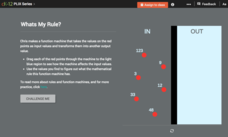
Function Rules for Input-Output Tables: Whats My Rule?
What's the rule that makes it true? A virtual function machine generates output values as learners submit the input values. Their job is to analyze the inputs and outputs for a pattern and write a function rule.
CK-12 Foundation
Function Rules for Input-Output Tables: Function Machine!
Watch as a function machine converts an input to an output. Learners determine the work applied by the function machine to write a function rule. Questions accompany the function machine animation to guide individuals to conclusions.
CK-12 Foundation
Function Rules for Input-Output Tables: Tickets at an Arcade
This is the ticket to learning about function rules! Using online manipulatives, scholars build a table of values and then answer questions about the related function. They examine the relationship between the input and output values and...
CK-12 Foundation
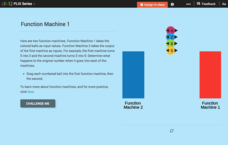
Function Rules for Input-Output Tables: Function Machine 1
Challenge your classes to find the pattern of a double function machine. After recording the outputs of both machines, learners identify the pattern and the corresponding function. Both patterns involve adding/subtracting a constant.
EngageNY
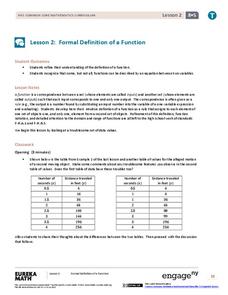
Formal Definition of a Function
Formalize the notion of a function. Scholars continue their exploration of functions in the second lesson of the module. They consider functions as input-output machines and develop function rules for selected functions.
EngageNY
Graphs of Functions and Equations
Explore the graphs of functions and equations with a resource that teaches scholars how to graph functions as a set of input-output points. They learn how the graph of a function is the graph of its associated equation.
EngageNY
Graphs of Linear Functions and Rate of Change
Discover an important property of linear functions. Learners use the slope formula to calculate the rates of change of linear functions. They find that linear functions have constant rates of change and use this property to determine if...
Willow Tree
Linear Relationships
There's just something special about lines in algebra. Introduce your classes to linear equations by analyzing the linear relationship. Young mathematicians use input/output pairs to determine the slope and the slope-intercept formula to...
West Contra Costa Unified School District
Evaluating Functions
Functions as inputs for other functions? After reviewing function notation and how to input values to evaluate functions, class members input functions into functions, essentially determining the composition of functions.
Scholastic
Study Jams! Function Tables
Each week Mia saves a certain portion of the earnings from her babysitting job. Help her figure out how much she can save this week with a step-by-step presentation on function tables. Given a set of inputs and outputs, the process for...
EngageNY
Comparing Linear Functions and Graphs
How can you compare linear functions? The seventh installment of a 12-part module teaches learners how to compare linear functions whose representations are given in different ways. They use real-world functions and interpret features in...
EngageNY
Linear Functions and Proportionality
Connect linear equations, proportionality, and constant rates of change to linear functions. Young mathematicians learn how linear equations of the form y = mx + b can represent linear functions. They then explore examples of linear...
West Contra Costa Unified School District
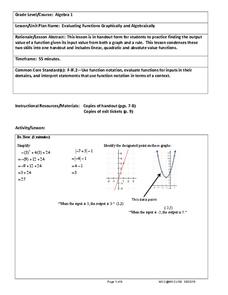
Evaluating Functions Graphically and Algebraically
High schoolers evaluate functions graphically and algebraically. After completing that step, they write a statement describing the input and output.
Wordpress
Introduction to Exponential Functions
This lesson plan begins with a review of linear functions and segues nicely over its fifteen examples and problems into a deep study of exponential functions. Linear and exponential growth are compared in an investment task. Data tables...
Virginia Department of Education
Functions 1
Scholars learn what it means for a relation to be a function and see various representations of functions. After learning the definition, they participate in a card sorting activity classifying relations as functions or not.
Flipped Math
Modeling with Graphs
Create a graph for anything in the world. Pupils continue to work with graphs that model situations. The learners analyze different graphs to answer questions about the scenario along with finding equations of graphs. Scholars use...
University of North Texas
Library of Functions
Join the family picnic and see how all the functions come together in a PowerPoint that highlights their main features. As it includes topics such as domain, range, and intercepts, the slides are a great guide to promote class...
Illustrative Mathematics
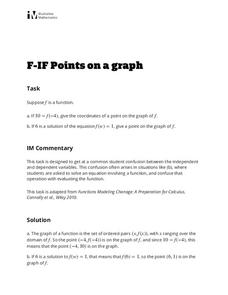
Points on a Graph
Learners practice using their knowledge of how to interpret a function and use function notation. The activity includes two questions. Given an input of a function and its output, the first question asks learners to write the ordered...
Teach Engineering
Discovering Relationships Between Side Length and Area
Consider the relationship between side length and area as an input-output function. Scholars create input-output tables for the area of squares to determine an equation in the first installment of a three-part unit. Ditto for the area of...
Curated OER
Domain and Range
Relations, and functions, and line tests, oh my! An instructional slideshow demonstrates the definitions of a relation, a function, and the domain and range of a relation. Viewers then learn how to use mappings and vertical...
Illustrative Mathematics
Distance across the channel
Here you will find a model of a linear relationship between two quantities, the water depth of a channel and the distance across the channel at water level. The cross section of the channel is the shape of an isosceles trapezoid. The...


