Math Worksheets Land
Pie or Circle Graphs - Guided Lesson
A guided lesson worksheet reinforces pie graph skills using a given set of data. Each problem requires young mathematicians to create a circle graph using five colors, and to provide a key that goes along with the graph.
National Security Agency
Line Graphs: Gone Graphing
Practice graphing and interpreting data on line graphs with 36 pages of math activities. With rationale, worksheets, and assessment suggestions, the resource is a great addition to any graphing unit.
Willow Tree
Circle Graphs
Pie isn't just for eating! Scholars learn to create pie charts and circle graphs to represent data. Given raw data, learners determine the percent of the whole for each category and then figure out the degree of the circle that percent...
Virginia Department of Education
Graphs
Examine different types of graphs as a means for analyzing data. Math scholars identify the type of graph from a series of data displays and then develop questions to match each one. Then, given a scatter plot of height versus age...
Balanced Assessment
Cost of Living
Math scholars investigate the cost of living in Hong Kong compared to Chicago but must first convert the different types of currency. They then choose a type of graph to compare different spending categories and finish the activity by...
Willow Tree
Histograms and Venn Diagrams
There are many different options for graphing data, which can be overwhelming even for experienced mathematcians. This time, the focus is on histograms and Venn diagrams that highlight the frequency of a range of data and overlap of...
Mathematics Vision Project
Module 2: Systems of Equations and Inequalities
The brother-sister pair Carlos and Clarita need your class's help in developing their new pet sitting business. Through a variety of scenarios and concerns presented to the siblings, the learners thoroughly explore systems of equations...
National Security Agency
Starting a Restaurant
Through an engaging unit, chefs-in-training will sort and classify data using tally charts. Learners will also create bar graphs to display restaurant data and interpret data from bar graphs using a variety of categories....
West Contra Costa Unified School District
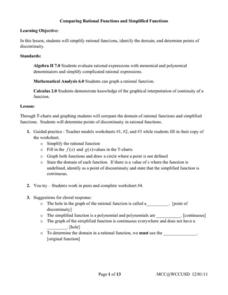
Comparing Rational Functions and Simplified Functions
What kind of functions have holes in their graphs? Here, the teacher guides the class on how to use the simplified function of a rational function to aid in the graphing of the original rational function. T-tables are used in order...
National Museum of Nuclear Science & History
Alphas, Betas and Gammas Oh, My!
Referring to the periodic table of elements, nuclear physics learners determine the resulting elements of alpha and beta decay. Answers are given in atomic notation, showing the atomic symbol, mass, atomic number, and emission particles....
North Carolina State University
Exploring Genetics Across the Middle School Science and Math Curricula
Where is a geneticist's favorite place to swim? A gene pool. Young geneticists complete hands-on activities, experiments, and real-world problem solving throughout the unit. With extra focus on dominant and recessive genes, Punnett...
Curated OER
Activity: An Experiment with Dice
Roll the dice with this activity and teach young mathematicians about probability. Record outcomes for rolling two number cubes in order to determine what is most likely to happen. Graph the data and investigate patterns in the results,...
State of Michigan
Pre-K Mathematics
Kick-start children's education with this pre-school math unit. Offering 31 different hands-on learning activities that develop young mathematicians' pattern and shape recognition, basic number sense, and much more, this is a...
Open Text Book Store
Arithmetic for College Students: Worksheets
Loaded with concepts ranging from multiplying decimals to converting units to solving problems using the order of operations, a thorough practice packet is perfect for a fifth or sixth grade math classroom.
ARKive
Handling Data: African Animal Maths
Handling and processing data is a big part of what real scientists do. Provide a way for your learners to explore graphs and data related to the animals that live on the African savannah. They begin their analysis by discussing what they...
Other popular searches
- Charts Graphs and Tables
- Tables, Graphs, Charts
- Graphs Charts Tables
- Maps, Charts, Graphs, Tables
- Charts, Tables, Graphs
- Charts, Graphs and Tables


