Curated OER
Solving Using Linear Equations
Seventh graders explore linear equations. They observe the relationship between linear equations an patterns. Students make decisions using information given in graphs to solve linear equations. They perform a toothpick activity to...
Curated OER
Coordinate Geometry
In this geometry learning exercise, students calculate the midpoint and distance between two points. They use the correct formula to solve the area and perimeter of polygons. There are 20 multiple choice questions with an answer key.
Curated OER
Finding the Distance and Midpoint of a Line Segment
Students use the Pythagorean formula to find the length of a line. Afterward, they explore the midpoint formula to determine the midpoint of a line with a non-zero slope on a coordinate plane. Students complete assigned problems and...
Mathalicious
Domino Effect
Carryout the lesson to determine the cost of pizza toppings from a Domino's Pizza® website while creating a linear model. Learners look through real data—and even create their own pizza—to determine the cost of each topping. They...
Curated OER
Connecting Algebra and Geometry Through Coordinates
This unit on connecting algebra and geometry covers a number of topics including worksheets on the distance formula, finding the perimeter and area of polynomials, the slope formula, parallel and perpendicular lines, parallelograms,...
Curated OER
Writing Linear Equations in Different Forms
This learning exercise is jam-packed with linear equations! Learners write equations in slope-intercept form and standard form. Horizontal and vertical lines are included, as well as graphs for several of the problems. A great way...
Illustrative Mathematics
Introduction to Linear Functions
Introduce your algebra learners to linear and quadratic functions. Learners compare the differences and relate them back to the equations and graphs. Lead your class to discussions on the properties of a function or a constant slope...
Curated OER
Velocity and Acceleration
Compliment your physics lesson with this PowerPoint which demonstrates many important points regarding acceleration and velocity. A starter experiment activity to stimulate student thinking is given, and may prove very interesting to a...
EngageNY
Parallel and Perpendicular Lines
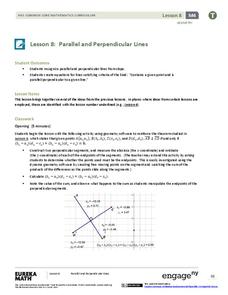
Use what you know about parallel and perpendicular lines to write equations! Learners take an equation of a line and write an equation of a line that is parallel or perpendicular using slope criteria. They then solve problems to...
EngageNY
End-of-Module Assessment Task: Grade 8 Module 4
Connect proportional linear equations and systems. The seven-question assessment is the last installment in a 33-part series. The items cover comparing proportional relationships, slope concepts, and simultaneous linear...
Cornell University
Math Is Malleable?
Learn about polymers while playing with shrinky dinks. Young scholars create a shrinky dink design, bake it, and then record the area, volume, and thickness over time. They model the data using a graph and highlight the key features of...
Curated OER
Equal Differences Over Equal Intervals 1
Learners explore linear functions concretely using tables of values in a cooperative task. The concept of the values of linear functions changing by equal differences over equal intervals of one is emphasized. Learners will discover...
5280 Math
More or Less the Same
Tell the story of the math. Given a graph of a linear system, learners write a story that models the graph before crafting the corresponding functions. Graphs intersect at an estimated point, allowing for different variations in the...
Curated OER
What Do Maps Show?: Lesson 4 How to Read a Topographic Map
Students examine the use of topographic maps as two dimensional representations that show elevations and slopes with contour lines. They read maps of the Salt Lake City, Utah area and complete the associated worksheets that show map...
American Statistical Association
You and Michael
Investigate the relationship between height and arm span. Young statisticians measure the heights and arm spans of each class member and create a scatter plot using the data. They draw a line of best fit and use its slope to explain the...
Curated OER
Compound Inequalities and Graphing
Put geometry skills to the test! Learners solve compound inequalities and then graph the inequalities on a coordinate plane using their geometric skills. They identify the slope and y-intercept in order to graph correctly. I like this...
Virginia Department of Education
Distance and Midpoint Formulas
Small groups work through two guided activities to derive the distance and midpoint formulas for the coordinate plane. The activities begin with concrete examples and move to abstract.
Howard County Schools
Constant Rate Exploration
Question: What do rectangles and bathtub volume have in common? Answer: Linear equations. Learn how to identify situations that have constant rates by examining two different situations, one proportional and one not proportional.
Illustrative Mathematics
Who Has the Best Job?
Making money is important to teenagers. It is up to your apprentices to determine how much two wage earners make with their after school jobs. Participants work with a table, an equation, and a graph and compare the two workers to see...
Mathematics Assessment Project
Square
Don't be a square! Young mathematicians determine the slope and length of a line segment. They then prove whether four given coordinate points form a square.
Curated OER
Worksheet 3: Earth's Climate System II
A diagram of a mountain range and the prevailing winds is shown at the top of the page. Meteorology pupils describe the weather conditions at different points on the diagram. They explain the El Nino effect and why evaporation and...
Kenan Fellows
Man vs. Beast: Approximating Derivatives using Human and Animal Movement
What does dropping a ball look like as a graph? An engaging activity asks learners to record a video of dropping a ball and uploading the video to software for analysis. They compare the position of the ball to time and calculate the...
Curated OER
Practice Problems for Linear Equations and Graphs
A worksheet that could also be used as a quiz presents students with 20 linear equations. They graph, solve for the slope, and intercepts of 8 equations. Students solve for the equation of a line, passing through given points for 6 sets...
Curated OER
Integration: Geometry, Parallel and Perpendicular Lines
In this math worksheet, students write linear equations in slope-intercept form that passes through the given point. On the last 8 equations, students write the equation of the perpendicular line.
Other popular searches
- Two Points Slope Formula
- Finding Slope From Two Points
- Slope From Two Points
- Slope Given Two Points
- Slope Two Points


