Illustrative Mathematics
Foxes and Rabbits 2
The fox population chases the rabbit population. Groups model the populations of foxes and rabbits with two trigonometric functions. Individuals graph both trigonometric models on the same graph, and then teams determine an explanation...
EngageNY
End-of-Module Assessment Task: Grade 8 Module 6
Test your knowledge of linear functions and models. The last installment of a 16-part module is an end-of-module assessment task. Pupils solve multi-part problems on bivariate data based on real-world situations to review concepts from...
CCSS Math Activities
Smarter Balanced Sample Items: 6th Grade Math – Claim 2
They claim there are problems on the assessment. The presentation provides 13 questions that demonstrate the problem-solving claim for Smarter Balanced assessments. Teachers use the resource to provide examples of problem-solving...
EduGAINs
Discovery of Pi
Serve up a slice of math for Pi Day! A combination of fun, hands-on lessons and helpful worksheets encourage learners to practice finding the radius, diameter, and circumference of different circles.
Earth Watch Institute
Entering Local Groundhog Data in an Excel Spreadsheet
Here is a cross-curricular ecology and technology lesson; your learners create spreadsheets depicting the location and number of groundhog dens in a local park. They research groundhogs and analyze data about where the groundhog...
Florida Department of Health
Mental and Emotional Health Education Unit
Stressed out? To begin a mental and emotional health unit, participants take a stress test to determine their level of stress. They study the effects of stress, identify sources of stress in their lives, and learn different ways to...
Curated OER
Multiplication BINGO
Students receive a multiplication BINGO card. Students are given the answers to the fact cards that may be given during the game. Students arrange these answers in random places on their BINGO board. As each fact card is shown, students...
Illustrative Mathematics
Foxes and Rabbits 1
Here is where algebra learners begin to understand that a function is a rule, and for each input there is exactly one output. The commentary gets bogged down with information about the predator-prey relationship between the fox and...
Curated OER
When A Story Met A Sandwich
How is a story like a peanut butter and jelly sandwich? Use making a sandwich as a metaphor to remind your writers that a good, solid beginning, a rich and rewarding middle, and an ending that brings everything together spices up a...
Towson University
Berries...With a Side of DNA? (High School)
Is DNA still present after picking fruit or cooking vegetables? Biology scholars extract and collect DNA strands in an impactful lab. Working groups prepare their samples and compare their results to negative and positive standard...
Consortium for Ocean Science Exploration and Engagement (COSEE)
Carbon Dioxide & Krill: Impacts
What effects do temperature and carbon dioxide levels have on the zooplankton of Antarctica? This concluding lesson plan in a short unit on climate change and the ocean helps environmental scientists answer these questions. After...
Scholastic
Narrative Writing
If you're looking to start a unit based around narrative writing, make sure to consider this resource while you're planning. This book covers five topics: writing personal narratives, writing narratives about others, writing...
PricewaterhouseCoopers
Saving and Investing: Building Wealth for Financially-Secure Futures
While spending is fun, saving for a retirement is the future. Young adults learn about the importance of saving and different opportunities to do so during their adulthood.
Curated OER
Speed + Graphing = Winners!
Fifth graders take addition timed tests every day for a two week period. Using the data from the timed tests, they create a bar graph using Microsoft Excel computer software, a personal bar graph using graph paper and colored pencils,...
Curated OER
Plotting the Petroleum Plume
Eighth graders examine the difference between confining layers and aquifers in a basic water table aquifer scenario. They contour groundwater elevation and petroleum product thickness data.
Curated OER
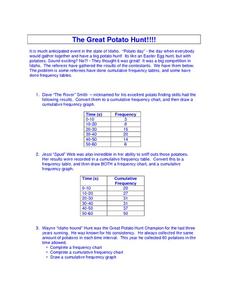
The Great Potato Hunt
In this science worksheet, students examine the data from the potato hunt where potatoes are found like Easter Eggs. The data of the number of potatoes found is recorded in the frequency tables.
Curated OER
Dynamic Earth
Young scholars show how earthquakes affect sea waves. In this tidal waves instructional activity students use a rubber mallet on a table to create waves in a box on top of the table. They experiment with striking the mallet in different...
Curated OER
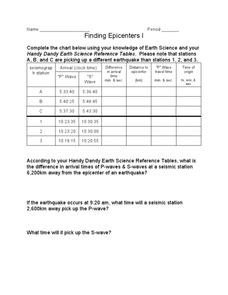
Finding Epicenters 1
In this finding epicenters worksheet, learners complete a table given the "P" and "S" wave arrival times of 6 different earthquakes. Students calculate the difference in arrival time of the waves, the distance to the epicenter, the "P"...
Creative Chemistry
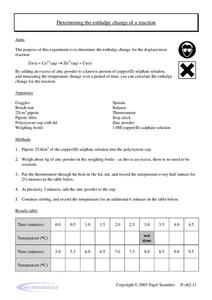
Determining the Enthalpy Change of a Reaction
For this enthalpy of reactions learning exercise, high schoolers use a known amount of copper (II) sulphate solution and an excess of zinc powder to calculate the reaction's enthalpy change. Students measure the temperature change...
Curated OER
Working with Half-Life
In this half-life worksheet, students use a given table of half lives, mass, time and amount of original sample to solve for unknowns in nine given half-life problems.
Curated OER
First Class Lever Lab
For this first class lever worksheet, learners investigate the mechanical advantage of this simple machine. Students change the effort arm and the resistance arm and calculate the resistance force, effort force and the...
Curated OER
Coloring Interval Graphs
Students investigate planning an activity and getting it done on time. In this algebra lesson, students define vocabulary words related quadratic equations, including the vertex and intervals. They figure a good way to color graphs...
Curated OER
Weather Data Analysis
In this weather learning exercise, students read a data table comparing the temperature and weather conditions at three different locations. Students use this data to complete 8 fill in the blank, 1 short answer question, and one graph.
Curated OER
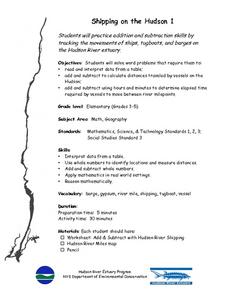
Shipping on the Hudson
Students track movements of ships, tugboats, and barges on the Hudson River estuary in order to practice addition and subtraction skills. They solve word problems by reading and interpreting data from a table. They calculate distances...


