Curated OER
Drug Sales Soar: Bar Graph
In this graphs worksheet, students analyze a bar graph that shows retail prescription drug sales in the U.S. Students complete five problem solving questions about the data on the graph.
Curated OER
Drug Sales Soar - Rate of Change
In this prescription drug worksheet, students answer short answer questions and create graphs on the sales of prescription drugs over a five year span. Students complete six questions.
Curated OER
Mathematics in Bioengineering: Its Application for Today's Students
High schoolers explore the different fields of bioengineering. They will create and interpret graphs from cancel cells data. They then calculate the amount of drugs found in blood and eliminated by the body over time.
National Council of Teachers of Mathematics
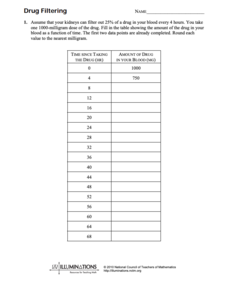
Drug Filtering
In this chemistry instructional activity, learners calculate the amount of drug found in someones blood based on how long they have been taking the drug. There are 5 questions.
Mascil Project
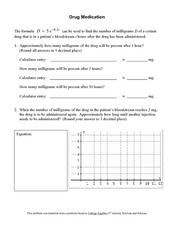
Drug Concentration
Different medications leave the body at different rates, and how people take them determines their effectiveness. Learners investigate this effectiveness by charting the concentration of a given medication in the body. Using exponential...
Curated OER
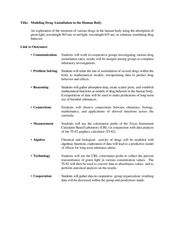
Modeling Drug Assimilation in the Human Body
Students investigate the accumulation of drugs in the body. In this algebra lesson, students collect data on drug retention and assimilation. They use their data to predict the behavior and effects of drugs.
Curated OER
Graphing Current Drug Data
Students increase understanding of the drug issue and further develop skill in graphing.
Curated OER
Price of Sickness
In this American health worksheet, learners analyze a graph of prescription drugs in the U.S. over five years. Students use the data to answer 5 problems about the rate of change.
Curated OER
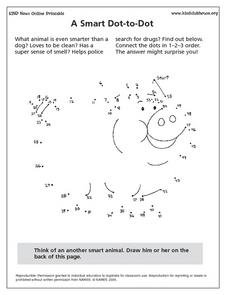
A Smart Dot-to-Dot
For this farm animals worksheet, students connect the dots in 1-2-3 order to figure out the animal that is even smarter than a dog and helps police find drugs.
Curated OER
Echinacea No Cure all for Kids
High schoolers look at real data and answer the question of whether or not they would recommend Echinacea to cure a cold. In this investigative lesson students describe whether the data supports the hypothesis that echinacea shortens the...
Discovery Education
Malachi's Medication
What's on a prescription medicine label? After learners practice measuring Malachi's prescribed dosage for his medication, they collaboratively discuss and explain why measuring it with the proper measuring tools is essential. Young...
CK-12 Foundation
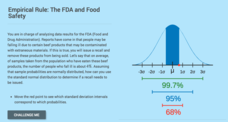
Computing Probabilities for the Standard Normal Distribution: The FDA and Food Safety
To recall or not to recall, that is the question. Using provided data, pupils calculate the percent of people that may fall ill on average. The scholars determine the standard deviation based upon the mean and the empirical rule, then...
Curated OER
Lunch Food? Mmmm! Mmmm! Good!
Examine how nutrition plays an important role in our lives by conducting online research and developing lunch menus that satisfy nutritional requirements set up by the United States Department of Agriculture. Students download recipes,...
Curated OER
Course of Antibiotics
This model of the amount of anibiotics in a person's system is represented abstractly by a finite geometric series. Learners translate this real-life situation into algebraic form and then extend their knowlege by answering questions...
Curated OER
Comparing Fractions with Objects and Pictures
Scholars will compare fractions using objects and pictures. They view pre-made pictures and concrete objects of fractions. Then use small white boards to draw pictorial representations of fractions.
Curated OER
Linear or Exponential?
Your learners analyze various real-life contexts to decide if each is a linear or exponential model. This could be used as an assessment of learners' skills of discerning between a linear and an exponential model.
Curated OER
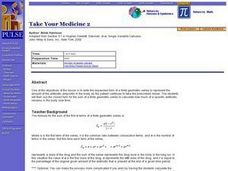
Take Your Medicine 2
Real-world application of the finite geometric series. Sick? Need to take Ampicillin? How much is in the body at any given point in time as this medication is taken over the course of time. Use the formulas, make calculation, and graph...
Curated OER
And You Thought Gasoline Was Expensive!
Students carry out a cost analysis. In this comparative math lesson, students compare the cost of equal measures of gasoline to mouthwash, house paint, fruit juice, white-out, and other liquids.
Curated OER
Tuberculosis Project
Reasearch the transmission of tuberculosis and design a communication product to help youth understand the risks of the disease, how it is tested for, and the benefits of proper treatment. This project incorporates language arts, math,...
Curated OER
Quadratic and Linear Equations
In this algebra worksheet, 11th graders solve a variety of problems using linear and quadratic properties as it pertains to functions. There are 12 questions.
Curated OER
The Perfect City
Students analyze group influences on people, events and culture. They design their own perfect society and report it to the class.
Curated OER
Money and health
Students write a proposal with an appropriate budget to establish a health day at school. They design this day to educate and promote good health. They educate other students about health care, inform students of health concerns, and...
Curated OER
What Did It Cost 100 Years Ago?
Students compare prices of good across the century in order to introduce the topic of inflation. They undertand the concepts of inflation and Consumer Price Index (CPI), use online calculators to figure the approximate cost of goods...
Curated OER
Statistics
In this statistics activity, 9th graders solve and complete 10 various types of multiple choice problems. First, they determine the mean number of miles per day that were completed. Then, students determine the data set that has a median...
Other popular searches
- Drugs and Alcohol
- Say No to Drugs
- Drugs & Alcohol
- Illegal Drugs
- Alcohol Drugs
- Alcohol Tobacco Drugs
- Smoking and Drugs
- Prescription Drugs
- Depressant Drugs
- Drugs, Alcohol and Tobacco
- Addiction to Drugs
- Drugs Brain


