Curated OER
Quadratic Functions
In this algebra activity, students perform transformations on quadratic functions. They describe the different properties of quadratic functions. There are 12 problems.
Curated OER
Strong Arm Iteration
Students solve exponential functions and inequalities. In this algebra instructional activity, students find the roots of equations and use it to graph and evaluate exponential functions. They simplify exponents using the law of exponents.
Curated OER
Rational Function Graphs
Students use algebraic methods to represent and solve problems. Using a graphing calculator, students solve rational and inequality problems. They visually demonstrate solutions of functions through graphing. Students answer questions...
Curated OER
The Reciprocal Function Family
In this Algebra II worksheet, 11th graders examine the reciprocal function family in the form y = a/(x – h) + k, identifying the vertical and horizontal asymptotes. The two page worksheet contains explanation, examples, and two...
Curated OER
Periodic Functions
In this Pre-Calculus worksheet, students solve problems involving periodic functions. The three page worksheet contains twenty-three problems. Answers are not provided.
National Security Agency
Systems of Equations and Inequalities
High school classes can use manipulatives too! Offer hands-on, interactive lessons that venture away from the typical day in your algebra class. Young mathematicians will be involved in collaborative learning, visual...
EngageNY
Ferris Wheels—Tracking the Height of a Passenger Car
Watch your pupils go round and round as they explore periodic behavior. Learners graph the height of a Ferris wheel over time. They repeat the process with Ferris wheels of different diameters.
EngageNY
Rational Exponents—What are 2^1/2 and 2^1/3?
Are you rooting for your high schoolers to learn about rational exponents? In the third installment of a 35-part module, pupils first learn the meaning of 2^(1/n) by estimating values on the graph of y = 2^x and by using algebraic...
Curated OER
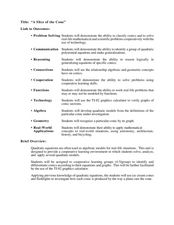
"A Slice of the Cone"
Here is a set of lessons that explore conics in a number of different ways. Starting with modeling how a conic is produced by the way a plane cuts the cone, to solving complex word problems, algebra learners progress through a series of...
EngageNY
Linear Systems in Three Variables
Put all that algebra learning to use! Using algebraic strategies, learners solve three-variable systems. They then use the three-variable systems to write a quadratic equation given three points on the parabola.
EngageNY
Analyzing Residuals (Part 2)
Learn about patterns in residual plots with an informative math activity. Two examples make connections between the appearance of a residual plot and whether a linear model is the best model apparent. The problem set and exit ticket...
Virginia Department of Education
How Much is that Tune?
Tune in for savings! Scholars investigate pricing schemes for two different online music download sites. After comparing the two, they determine the numbers of songs for which each site would be cheaper.
West Contra Costa Unified School District
Investigating the Discriminant
When is finding the discriminant enough? Using the quadratic formula helps find solutions to quadratic equations, but there are times when just using the discriminant is appropriate. Use this algebra II lesson to help classes see...
Mathematics Vision Project
Module 1: Sequences
Take steps into sequences. An 11-lesson unit builds upon pupils' previous understanding of writing expressions to develop the idea of sequences. The resource explores both arithmetic and geometric sequences using recursive and explicit...
Curated OER
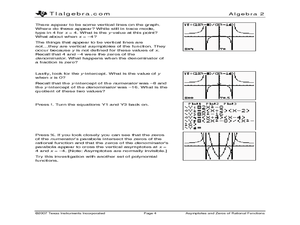
Asymptotes and Zeros
Learn how to explore rational functions and investigate the graphs rational functions and identify its singularities and asymptotes. Students approximate the solutions to rational equations and inequalities by graphing.
Curated OER
Solving Quadratic Equations
In this Algebra I/Algebra II worksheet, students solve quadratic equations by graphing and by taking the square root of both sides. The two page worksheet contains a combination five multiple choice and free response...
Curated OER
Woody Sine
Students explore the concept of sine. In this sine activity, students create a sine graph from tooth picks. Students create a unit circle with tooth pick length radius. Students then take the tooth picks from the unit circle and put them...
Curated OER
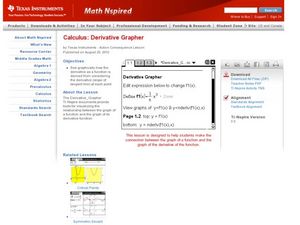
Derivative Grapher
Learners graph the derivative of functions in this calculus lesson plan. They use the TI to graph their functions and algebraically take the derivative of each function. They then create a visual and analyze the graph.
Curated OER
Trigonometry and the Calculator
In this geometry worksheet, 10th graders use a graphing calculator to evaluate trigonometric functions and their inverses. The four page worksheet contains explanation, examples, and twenty questions. Answers are not...
Curated OER
Multiplying Monomials
Students differentiate between linear and quadratic functions. For this algebra lesson, students write equations of graphs and graph a function from an equation. They also identify the slope and y-intercept.
Curated OER
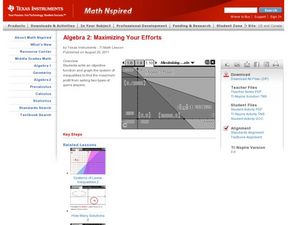
Maximizing Your Efforts
Students graph systems of equation. In this algebra instructional activity, students find where the lines cross and identify the type of solution. They analyze a graph and write the equation of the line.
Curated OER
Quadratic Inequalities
In this quadratic inequalities worksheet, students graph six quadratic inequalities. They solve two quadratic inequalities to identify one solution. In this quadratic inequalities worksheet, students draw the parabola and shade inside or...
Curated OER
Simple Inequalities on a Number Line
Young scholars solve inequalities problems. In this algebra lesson, students graph the solution of inequalities on a number line. They discuss boundaries and open or closed intervals.
Curated OER
Make a Pass at Me
Students identify different types of functions and units of measurements. In this statistics lesson, students will collect data, graph their data and make predictions about their data. They plot a linear regression graph.

