Curated OER
Chairs Around the Table
Youngsters become flexible problem solvers with this challenging lesson. If there are 24 square tables in a restaurant, how many customers can be seated at one time? They can use manipulatives or draw pictures to help them find the...
Concord Consortium
Functions by the Slice
Piece by piece ... dismantling a function can highlight interesting patterns. The task asks learners to slice functions in sections with the same vertical change. They then recreate the graph with these slices positioned horizontally....
Shodor Education Foundation
Spinner
Go round and round to compare theoretical and experimental probabilities. Learners set the number of sectors and the number of spins for a spinner. Then, a table displays the experimental and theoretical probabilities of the spinner for...
Curated OER
Creating a Thematic Map
Students create and analyze a weather-related data table and a thematic map based upon information provided.
Curated OER
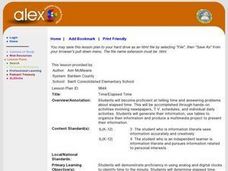
Time/Elapsed Time
Young mathematicians complete various activities to demonstrate proficiency in telling time and identifying elapsed time. They analyze and discuss television schedules, create a booklet about their daily activities, produce a TV. guide,...
Curated OER
Discovering Pi
Define terminology related to a circle. Practice accuracy in measuring and then create a spreadsheet based on data collected from solving for parts of a circle. Groups can have fun analyzing their data as it relates to Pi.
Curated OER
Cutting Expenses
Learners explore budgeting. In this finance and math instructional activity, students brainstorm ways in which households could save money. Learners view websites that give cost reducing ideas. Students complete an expense comparison...
Curated OER
Voter Turnout
Explore politics by analyzing the voting process. Pupils discuss the purpose of casting votes in an election, then examine graphs based on the data from a previously held election's turnout. The lesson concludes as they answer study...
Council for Economic Education
Sand Art Brownies
Which is better, Coke or Pepsi? Pupils analyze the concept of substitute goods as they investigate the choice to purchase alternate products for better prices. Fun and practical, the engaging shopping exercise helps savvy scholars get...
Houston Area Calculus Teachers
Polynomial Graphing
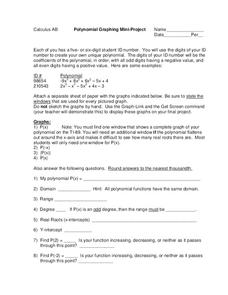
Your AP Calculus learners probably have their ID numbers memorized, but have they tried graphing them? Pique your pupils' interest by asking each to create a unique polynomial function based on their ID numbers, and then analyze the...
Charleston School District
Constructing Dilations
Pupils multiply the vertical and horizontal distances from the center of dilation by the scale factor. The independent practice prompts the class to analyze the relationship between the image and pre-image. The lesson is part three in a...
Mathematics Assessment Project
Middle School Mathematics Test 3
Real-life mathematics is not as simple as repeating a set of steps; pupils must mentally go through a process to come to their conclusions. Teach learners to read, analyze, and create a plan for solving a problem situation. The provided...
Balanced Assessment
Postcards from the Falls
Pupils use graphs to analyze two pricing schemes for postcards. After determining which is the best deal, individuals determine what is wrong with the other pricing structures and explain their thinking.
Shodor Education Foundation
Stem and Leaf Plotter
The key is in the leaves. Pupils enter data to create a stem-and-leaf plot. The resource then displays the plot and calculates the mean, median, and mode of the data. Using the plot and the calculated measures of spread, learners analyze...
American Statistical Association
EllipSeeIt: Visualizing Strength and Direction of Correlation
Seeing is believing. Given several bivariate data sets, learners make scatter plots using the online SeeIt program to visualize the correlation. To get a more complete picture of the topic, they research their own data set and perform an...
Curated OER
Patterns That Grow
Students investigate growing patterns. In this additive patterns lesson, students analyze the core of growing patterns. Students extend additive patterns based on the core.
Curated OER
Show Me!
Students analyze and interpret graphs. In this graphing instructional activity, students view a video and construct their own graphs (line, circle, bar) from given sets of data.
Curated OER
Counting Exercise
In this counting objects worksheet, learners analyze pictures of shapes and animals inside the house. Students count the objects specified and fill out a chart with numbers telling how many of each picture.
Curated OER
Introduction to Fractions: Halves, Thirds, Fourths
In this math worksheet, students learn basic fraction concepts with wholes, halves, thirds and fourths. Students analyze pictures which have been divided and fill in the answers to questions such as, "What fraction of the squares are red?"
Curated OER
Which Image Matches the Word?
In this math worksheet, students read the name of a geometric figure and analyze the drawings next to it. Students color the image that matches the word.
Curated OER
Get the Picture?
Students explore the movement to design low-cost solutions for the world's population and create a graph to represent the information. In this design and graphing lesson, students review the concepts of graphing and visit the...
Curated OER
Human Genetic Traits
Students investigate dominant and recessive traits by studying their schoolmates. In this genetics lesson, students analyze specific traits of other children in school and create a database of information based on whom carries which...
Curated OER
How Many?
In this counting worksheet, students analyze a picture of an apple tree with a background of birds and clouds. Students count and record the number that tells how many birds, clouds and apples. Students then color the picture.
Curated OER
Food Patterns
In this patterns worksheet, students cut out six pictures of foods. Students analyze the food pictures in each row and paste the next two foods that will continue the pattern.


