CK-12 Foundation
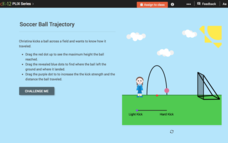
Quadratic Functions and Their Graphs: Soccer Ball Trajectory
Determine critical points in the flight of a soccer ball. Pupils use an interactive resource to find the vertex and x-intercepts of the graph of the trajectory of a soccer ball after being kicked. Scholars investigate the trajectory...
CK-12 Foundation
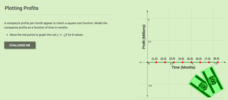
Graphs of Functions Based on Rules: Plotting Profits
Profit from this interactive on graphing and interpreting functions. An interactive allows learners to plot a square root function representing a company's profits. They answer some challenge questions that require interpreting this...
CK-12 Foundation
Bar Graphs, Frequency Tables, and Histograms: Comparing Heights
Become a master at creating visual displays. Using a provided list of heights, users of the interactive create a bar graph and a histogram. They answer a set of challenge questions based on these data representations.
CK-12 Foundation
Broken-Line Graphs: Heating Curve of Water
Examine the unique graphs coined broken-line graphs. Using the phase change of water for data, learners answer questions related to the temperature and energy at different times in the cycle of the phase change. Questions focus on the...
CK-12 Foundation
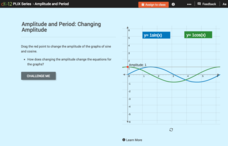
Sine Graph and Cosine Graph: Changing Amplitude
Scholars manipulate the amplitude of the graphs of sine and cosine, notice how the change in amplitude is reflected in their graphs, and answer several questions about the concept they noticed.
CK-12 Foundation
Multiple Bar Graphs
I scream, you scream, we all scream for ice cream bar graphs. Pupils create a multiple bar chart to represent the sales of ice cream products during the first week of summer. Using the chart, learners find the day that each of the...
CK-12 Foundation
Interpretation of Circle Graphs: Northwest Region Population Pie
Given populations of the five Northwestern states, learners create a circle graph. Using the data and the pie chart, they make comparisons between the populations of the states. Finally, the pupils determine how the chart will change...
Learning Games Lab
The Magic of Reading Graphs
Making conclusions from graphs doesn't need to seem like magic. Learners explore an interactive lesson on reading graphs to strengthen their skills. The content discusses how to read the axes of a graph and draw conclusions based on the...
CK-12 Foundation
Graphs for Discrete and for Continuous Data: Discrete vs. Continuous Data
Not all data is the same. Using the interactive, pupils compare data represented in two different ways. The learners develop an understanding of the difference between discrete and continuous data and the different ways to represent each...
CK-12 Foundation
Misleading Graphs (Identify Misleading Statistics): Are Virgos Cursed?
Is it safe to take data at its face value? Pupils use the interactive to evaluate a claim that Virgos are more likely to get into a car crash than others. Individuals determine whether another variable may be at play.
CK-12 Foundation
Input-Output Tables for Function Rules
How does changing a graph affect the function? Learners watch the changing input-output table as they adjust the location of the line graph. Questions prompt them to complete a table of values and determine the function rule.
CK-12 Foundation
Horizontal Translations or Phase Shifts: Tangent
Patterns can be shifty! Find the pattern when shifting the graph of tangent. Pupils move the graph of tangent to different locations on the coordinate plane. They observe what happens to the function and its vertical asymptotes...
CK-12 Foundation
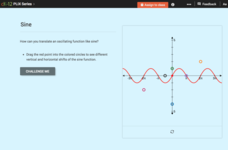
Horizontal Translations or Phase Shifts: Sine
Shift a trigonometric function and find its new equation. Pupils translate a sine function on a graph. The scholars determine the equation of the function that represents the translated graph and observe the connection between a...
CK-12 Foundation
Horizontal Translations or Phase Shifts: Cosine
If cosine is shifted, how is its equation affected? Learners manipulate the graph of cosine by moving the y-intercept to different locations on the coordinate plane. Pupils determine the new equation that models the shifts.
CK-12 Foundation
Horizontal Translations or Phase Shifts: Horizontal and Vertical Translations
It is all about the shift. Pupils translate the graph of a cubic function to different marked locations on the plane and determine the new equation that represents the shifts. The activity is designed to encourage individuals begin...
CK-12 Foundation
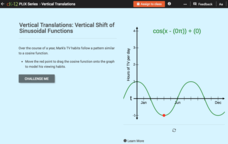
Vertical Translations: Vertical Shift of Sinusoidal Functions
Create a shift in TV viewing habits. The interactive presents a cosine model of an individual's TV viewing habits during a year. Class members move the model to reflect given conditions. Finally, they determine key features from the...
CK-12 Foundation
Checking Solutions to Inequalities: Apples and Bananas Shopping Excursion
Go bananas over a fun interactive! Learners drag a point on a virtual graph of an inequality to see if it is a solution. This helps determine the possible numbers of apples and bananas a shopper can buy with a given amount of money.
CK-12 Foundation
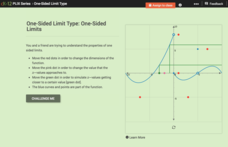
One-Sided Limit Type: One-Sided Limits
Not everything that's one-sided is bad. A slider interactive aids learners in investigating one-sided limits from graphs. A set of challenge questions assesses their understanding of the relationship between one- and two-sided limits.
CK-12 Foundation
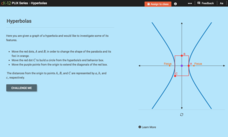
Hyperbolas
Hyperbolas—practice thinking outside of the box. Pupils alter the end behavior box to create various graphs of hyperbolas. They determine formulas to find the distance from the origin to the foci. Using that information, scholars...
CK-12 Foundation
Frequency Tables to Organize and Display Data: Favorite Films
What information can your class determine if they know the number of people attending movie showings? Using the information about the number of people at each screening, learners develop a frequency table. The pupils analyze the type of...
CK-12 Foundation
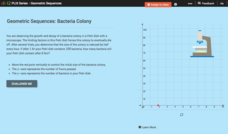
Geometric Sequences: Bacteria Colony
Show budding mathematicians how to model a diminishing bacteria colony two ways—graphically and algebraically. Using the coordinate axis, pupils create a graph to represent the decay of a bacteria colony. They determine the number of...
CK-12 Foundation
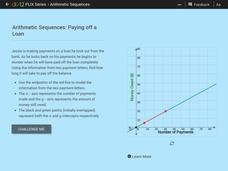
Arithmetic Sequences: Paying of a Loan
How long does it take to pay off a loan? Pupils use a graph to model the sequence associated with paying off a loan. Using the graph, learners determine the initial value and the common difference of the arithmetic sequence. The learners...
CK-12 Foundation
Types of Data Representation: Baby Due Date Histogram
Histograms are likely to give birth to a variety of conclusions. Given the likelihood a woman is to give birth after a certain number of weeks, pupils create a histogram. The scholars use the histogram to analyze the data and answer...
CK-12 Foundation
Restricted Domain and Range: Translation of a Curve
Moving the graph of a function obviously changes its domain and range. Scholars adjust the location of a graph in an interactive coordinate plane. The interactive automatically updates and displays the domain and range to show how it...
