Curated OER
Let's go to the Video Tape!
Using actual data from a deep-sea video survey, high school marine biologists consider the biodiversity, compare species richness between two communities, and learn to calculate the diversity index. The lesson plan is all-inclusive,...
Curated OER
Organic Molecules Detected on Distant Planet!
Here is a planet worksheet in which learners read about organic molecules detected through spectral lines of the planet Osiris. They calculate the mass, the volume and the densities of common ingredients for planets including Osiris and...
Illustrative Mathematics
Eight Circles
We are used to finding the area of a circle by plugging the radius into an equation. Here, learners are required to go further to find multiple areas and calculate the difference. They must detect a pattern in order to figure out the...
American Statistical Association
Confidence in Salaries in Petroleum Engineering
Just how confident can we be with statistics calculated from a sample? Learners take this into account as they look at data from a sample of petroleum engineer salaries. They analyze the effect sample size has on a margin of error and...
Curated OER
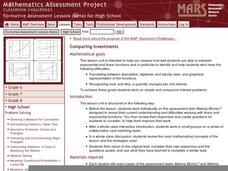
Comparing Investments
Money, money, money. A complete lesson that makes use of different representations of simple and compound interest, including written scenarios, tables, graphs, and equations to highlight similarities and differences between linear and...
Laying the Foundation
Box-and-Whisker Plots
Statistics is made approachable, and dare we say fun, in this activity on using box-and-whisker plots to analyze and compare data sets. Specific emphasis is placed on interpretations and explanations while graphing, and in using the...
Curated OER
Middle Grades Math: Balancing Equations
Learners solve linear equations. By observing the graph of each side of an equation using the TI-nspire graphing calculator, your class gains insight into solutions, as well as balancing equations and transforming linear equations....
Curated OER
Influence and Outliers
Using the TI-Nspire calculator, statisicians identify outliers and their effect on the least-squares regression line. In finding the line of best fit, they determine what points will affect the least squares regressions and what points...
Curated OER
UN-derstanding the United Nations
Use these interesting facts as a springboard for a culturally and globally diverse classroom discussion on the United Nations.
Alabama Learning Exchange
Solving Formulas for the Given Variable
Recycle, reuse, and rearrange! Young scholars learn to rearrange formulas to highlight a variable of interest. They then use their new formulas to make calculations.
Curated OER
Expressions - Activity 1
Learners create wax sculptures of a full body using mathematical calculations and information gathered from a video in this excellent art project. The lesson can be used along or within the unit provided.
Curated OER
Math: The Cathedral Project
Second graders take a field trip to a nearby church or other historical building and examine it from a mathematical perspective. In groups, they calculate the seating capacity, describe the window patterns, differentiate types of...
Curated OER
Exploring Renewable Energy Through Graphs and Statistics
Ninth graders identify different sources of renewable and nonrenewable energy. In this math lesson, learners calculate their own carbon footprint based on the carbon dioxide they create daily. They use statistics to analyze data on power...
Teach Engineering
Organic Solar Energy and Berries
You can eat a solar cell? A unit on solar energy begins with a discussion about organic solar cells, followed by directions on how to build your own. After following the teacher's directions to build an anthocyanin...
Yummy Math
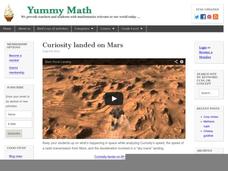
Curiosity Landed on Mars
Out of this world math and science are mixed together on a worksheet that would be a great enrichment activity classrooms that are studying our solar system. The information presented is best suited toward middle school math, and...
EngageNY
Searching a Region in the Plane
Programming a robot is a mathematical task! The activity asks learners to examine the process of programming a robot to vacuum a room. They use a coordinate plane to model the room, write equations to represent movement, determine the...
EngageNY
Ruling Out Chance (part 1)
What are the chances? Teach your classes to answer this question using mathematics. The first part of a three-day lesson on determining significance differences in experimental data prompts learners to analyze the data by...
EngageNY
Systems of Equations Leading to Pythagorean Triples
Find Pythagorean Triples like the ancient Babylonians. The resource presents the concept of Pythagorean Triples. It provides the system of equations the Babylonians used to calculate Pythagorean Triples more than 4,000 years ago. Pupils...
EngageNY
Using Linear Models in a Data Context
Practice using linear models to answer a question of interest. The 12th installment of a 16-part module combines many of the skills from previous lessons. It has scholars draw scatter plots and trend lines, develop linear models, and...
Teach Engineering
Building a Piezoelectric Generator
In pairs, learners build a piezoelectric generator from readily available electric components in the second and final installment of the two-part series. Tapping the piezoelectric element produces enough electricity to light an LED....
PBL Pathways
Gas Prices
How can math help your vehicle run better? Complete an interesting project-based learning task with your classes to determine the cheapest approach to mixing the ideal octane level of gasoline. Scholars create and solve a system of...
Beyond Benign
PPM
The 15th instructional activity in the series of 24 helps your classes understand the ppm (part per million) unit of measure. First, scholars experiment with food coloring to determine concentrations before applying their findings to...
Kenan Fellows
Introduction to a Flight Computer
Keep your hands on the wheel—at all times! Scholars learn why pilots use a flight computer through a high-flying demonstration. Making calculations for speed, distance, or time is automatic if you know how to use a flight computer.
Centre for Innovation in Mathematics Teaching
Ten Data Analysis Activities
This thirteen page data analysis worksheet contains a number of interesting problems regarding statistics. The activities cover the concepts of average measurements, standard deviation, box and whisker plots, quartiles, frequency...


