Curated OER
Student News And Weather Channel
Fabulous! Your 5th graders should love this project. As an ongoing lesson throughout the year students use temperature probes to record outside temperature and then document their data using spreadsheets. They use their weather data and...
Curated OER
Fish Communities in the Hudson
Learning to read data tables is an important skill. Use this resource for your third, fourth, or fifth graders. Learners will will study tables of fish collection data to draw conclusions. The data is based on fish environments in the...
Curated OER
Agriculture and the Government
Students study the government's involvement in the U.S. A's food production and make connections relating to farm programs. In this historical agriculture lesson, students read content and research significant information....
Curated OER
Can You Make a Hole in One?
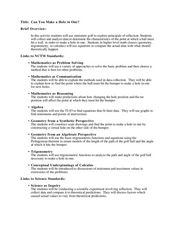
Students relate miniature golf to reflection of an image. In this algebra lesson, students collect and graph data as they study linear equations. They apply properties of graphing to solve real life scenarios.
Curated OER
Graphing the Forecast-Line Graph or Bar Graph?
Students explore bar and line graphs. In this data collection, graphing, and weather lesson, students compare bar and line graphs and discuss which type of graph would be most appropriate for displaying a ten day weather forecast....
Curated OER
M&M Graphing and Probability
Young scholars sort, classify, and graph M & M's. They create pictographs and bar graphs with the colors and numbers in each bag of M & M's. They calculate the ratio and probability based on class results.
Curated OER
The Appearance of a Graph
Sixth graders understand that the appearance and increment used on the x and y axis in a graph change how it looks. In this graphing lesson, 6th graders work in pairs and interpret graphs using different axes. Students collect graphs...
Curated OER
Animal Runners
In this collecting data instructional activity, 4th graders use the data shown on how fast 6 animals can run to create a bar graph. Students follow the instructions on 3 directives for their bar graphs and answer 1 short answer question.
Curated OER
TV Survey - Data Collection and Analysis
In this data collection and analysis learning exercise, 4th graders complete a tally chart about the number of hours that fourth graders watch television. They create a bar graph with the information, write a paragraph about the survey...
Curated OER
Favorite Days
Students collect and organize data about themselves. In this data analysis activity, students discuss their favorite calendar dates and explore ways to display the data.
Curated OER
Graph It with Coffee!
Students interview employers and employees at local coffee shops about sales and profits and create graphs comparing and contrasting information obtained about the businesses.
Curated OER
Creating Circles
Students make a circle graph. In this graphing lesson plan, the teacher conducts a class survey, then demonstrates how to make a pie graph. When students are comfortable with the material, they use a worksheet to create their own graph.
Curated OER
Data Lesson Vital Information
Students prepare and collect data and use excel and create a graph. They collect data about the number of pattern blocks that are put on tables. Students then record that data in Excel.
Curated OER
Statistics of Mars
Students explore the concept of central tendencies. In this central tendencies lesson, students sort M&M's or Skittles based on color. Students graph their results. Students find the mean, median, and mode of their data.
Curated OER
How do We Treat Our Environment?
Seventh graders explore the concept of collecting data. In this data collection lesson, 7th graders survey others about their environmental habits. Students graph their data.
Curated OER
M & M Madness
M&M's are always a great manipulative to use when teaching math. In this graphing lesson plan, learners predict how many of each color of M & M's there are. They count up each color and plug the data into a graph using the...
Regents Prep
Activity to Show Sample Population and Bias
There is bias in many aspects of our lives, and math is no exception! Learners explore provided data to understand the meaning of biased and random samples. The resource includes various data sets from the same population, and...
EngageNY
Distributions and Their Shapes
What can we find out about the data from the way it is shaped? Looking at displays that are familiar from previous grades, the class forms meaningful conjectures based upon the context of the data. The introductory lesson to...
Teach Engineering
Start Networking!
Class members create their own social networks by collecting signatures before graphing the interactions with their fellow classmates. The degree distribution of the simulated social network is determined by calculating the degree of...
Concord Consortium
Here Comes the Sun
Many phenomena in life are periodic in nature. A task-based lesson asks scholars to explore one of these phenomena. They collect data showing the sunrise time of a specific location over the period of a year. Using the data, they create...
National Council of Teachers of Mathematics
Eruptions: Old Faithful Geyser
How long do we have to wait? Given several days of times between eruptions of Old Faithful, learners create a graphical representation for two days. Groups combine their data to determine an appropriate wait time between eruptions.
Willow Tree
Scatterplots and Stem-and-Leaf Plots
Is there a correlation between the number of cats you own and your age? Use a scatter plot to analyze these correlation questions. Learners plot data and look for positive, negative, or no correlation, then create stem-and-leaf plots to...
Statistics Education Web
Consuming Cola
Caffeine affects your heart rate — or does it? Learners study experimental design while conducting their own experiment. They collect heart rate data after drinking a caffeinated beverage, create a box plot, and draw conclusions....
Chicago Botanic Garden
Are Global CO2 Levels Changing?
According to the Mauna Loa observatory, carbon dioxide levels increased by 3 ppm in our atmosphere between 2015–2016. Individuals analyze carbon dioxide data from around the world and then share this with a home group in lesson...


