NASA
The Search for Critical Questions
A puzzle isn't about the individual pieces, but how they work together. Scholars assemble a puzzle and discover missing pieces. They write a description of what they expect these pieces to look like, including as many details as...
Curated OER
The Scientific Method, Blood Typing, and Antibiotic Resistance
Students are given some components of an experiment, where they are able to identify and fill in missing parts, such as hypothesis, conclusion, results, etc. They form a hypothesis given general scientific facts. Students apply the...
EngageNY
Conditional Relative Frequencies and Association
It is all relative, or is it all conditional? Using an exploration method, the class determines whether there is an association between gender and superpower wish through the use of calculating conditional relative frequencies. The...
Curated OER
Piles of Paper
Track how much paper their class uses in a week. They will pile their used paper into one place, each day the pile is measured. They make predictions about how much paper they would collect in a month, then recycle the paper.
Virginia Department of Education
Energy and ATP
Take charge of your biology class by using this exciting analogy to relate the ATP process with batteries. Pupils use batteries and rubber bands to simulate the phosphate bonds between molecules in the body. They measure the distance in...
Pingry School
The Water Lab – Spreadsheet Simulation
More than 70 percent of people and 90 percent of businesses use spreadsheets regularly. While many courses overlook the important skill, the simple water lab focuses on entering spreadsheet data, formatting it, and printing plots based...
Curated OER
Transformations and Matrices
There are four activities in this extensive instructional activity covering the identity matrix and scaling, the linear representation of translations, the linear representation of rotations, and reflections. In small groups, they use...
Corbett Maths
The Median
Find the one in the middle. An informative resource explains how to determine the median of a set of numbers. Using both even and odd numbers of data points, the video covers the process of finding the middle number. Worksheets provide...
Space Awareness
The Big Meltdown
Explore the world (our world) of melting ice caps. Why are these caps melting? What is the effect of melting ice caps? Dive into the ever-present issue of global warming with a resource that has learners looking at data and participating...
College Board
2002 AP® Statistics Free-Response Questions Form B
Develop a deeper understanding of statistics. The six released free-response items from the 2002 AP® Statistics Form B involve several concepts that are currently in the regular statistics standards. Teachers see how...
Radford University
How Normal Are You?
It's completely normal to learn about normal distributions. An engaging lesson has young statisticians collect and analyze data about their classmates as well as players on the school's football team. They determine whether each set of...
iCivics
Step 7: Fill the Holes
It's time to communicate without using emojis or hashtags! In the seventh step of a 10-part County Solutions - High School unit scholars analyze professional communication when accomplishing a goal. They use examples, research, and data...
Concord Consortium
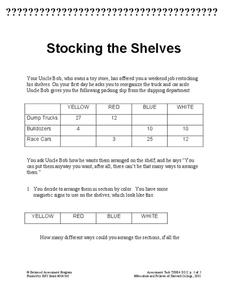
Stocking the Shelves
How many ways can you stock a shelf? It's probably more than you think! Young scholars use data in a frequency table to determine how many ways to stock a shelf given a specific constraint for types of groups. They then repeat the task...
Radford University
Big Future - How SAT Scores Play a Role in College Acceptance
Understanding the importance of SAT scores is as easy as ABC. A set of three statistics lessons teaches scholars about normal distributions, the Empirical Rule, and z-scores. They apply their newfound knowledge to investigate data...
Curated OER
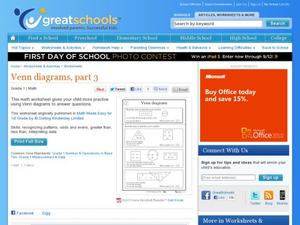
Venn Diagrams, Part 3
Can your first graders interpret Venn diagrams? Different sets of clues help pupils narrow down a specific number in different shapes. They determine odds and evens, greater than or less than, and what shape the number is in. A fun...
Nebraska Department of Education
Time Management
As eighth-graders move on to high school, strong time management skills become critical. As part of a career Planning & Management unit, scholars learn how to analyze their time and consider how their choices impact their ability to...
Curated OER
Generating Hypotheses and Experimental Design 1
Here is a thorough exercise in forming hypotheses for scientific investigations. Young scientists consider factors that may be related to the question they would like to address. They think through measurable changes that may result from...
Curated OER
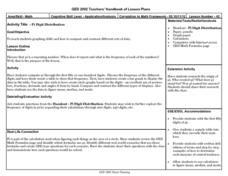
Pi Digit Distribution
Students study graphing skills and compare and contrast data sets. They compute pi through the first 50-100 digits and create a bar graph showing the frequencies of specific digits.
Curated OER
Rainbows, Bridges & Weather, Oh My!
Explore how real-world applications can be parabolic in nature and how to find quadratic functions that best fit data. A number of different examples of modeling parabolas are explored including a student scavenger hunt, the exploration...
Curated OER
Finding Equations
Students make equations from everyday data. They create a graph from the equations. Students predict and analyze the results. Students complete the second scenario on their own and turn in their handout.
Curated OER
On the Trail of the Hudson's Migratory Fish
Using data related to the fish in the Hudson River area, learners calculate distance, elapsed time, and growth. They learn about migratory fish, the life cycle of a fish, analyze a map, and answer questions.
Curated OER
Graphing Memories
Mem Fox’s Wilfrid Gordon McDonald Partridge provides the labels for a graphing activity. Class members create an illustration of a memory item brought from home, and place their illustration in the proper column of a graph. When the...
Curated OER
Simplified Vertical Rebound Testing
Students participate in a lab activity in which they examine a simple energy transformation system. Students test the rebound of elastomers, produce rebound data, and determine the kinetic energy transformed by the impact of a free...
Curated OER
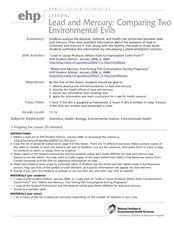
Lead and Mercury: Comparing Two Environmental Evils
High schoolers in chemistry or health courses look at the material safety data sheet (MSDS) and periodic table of elements to gather information about mercury and lead, two toxic materials that have been found in food products. They read...
Other popular searches
- Comparing Two Data Sets
- Comparing Sets of Data
- Comparing Related Data Sets
- Comparing Two Sets of Data
