Discovery Education
Mood Music!
Grouchy? Sad? Here's a great resource that shows kids how music can be used to lift their spirits. Kids collect and chart data on the effects of music on emotions. After analyzing the results of their experiment, they develop...
Curated OER
Solar System
Explore the solar system in detail, from it's origins to its components. Visual data gathered by actual space missions has been used to create the images and animations on each page of this stellar electronic book about the solar...
Curated OER
Quantifiers
Many people, regardless of their age, confuse similar words. Little or few, much or many, some or any...the list goes on and on! Use this online resource to test your learners' ability to choose the correct quantifier. Consider...
Curated OER
Handling Data- Health Statistics
In this social studies worksheet, students organize 50 country cards into groups. Students analyze a chart and group countries according to lowest, middle, and highest Infant Mortality Rate.
Curated OER
Data Analysis
In these analyzing data worksheets, learners complete a table and a pie chart and calculate mean, median, mode, and range for sets of data.
Curated OER
The Big Apple: Beginning Estimation and Math Skills, Working With Data
In this basic mathematics worksheets, students answer a set of 9 questions based on an "apple." Students then write 2 paragraphs discussing conclusions they have drawn from their data.
Curated OER
Ranging the Triple M's
Fifth graders explore collecting and analyzing data. In this mean, median and mode lesson, 5th graders use real word data to determine the mean, median and mode. Students are given sets of numbers on index cards as asked to find the...
Curated OER
Spaghetti Graphs
Students work in pairs to test the strength of spaghetti strands. They collect and graph data to determine a line of best fit. Students create a linear equation to interpret their data. Based on the data collected, students predict...
Curated OER
It's In The Chocolate Chips
Middle schoolers investigate which brand of chocolate chip cookies contains the most chocolate. They analyze and compare data using Microsoft Word and Microsoft Excel. They communicate the results with Microsoft PowerPoint.
Curated OER
Bubbles
Eighth graders experiment with a number of dishwashing liquids to determine the duration of the bubbles. They graph the data, add glycerin to the dishsoap, and repeat the experiment. They graph and compare the data sets.
American Statistical Association
How Random Is the iPod’s Shuffle?
Shuffle the resource into your activity repertoire. Scholars use randomly-generated iPod Shuffle playlists to develop ideas about randomness. They use a new set of playlists to confirm their ideas, and then decide whether the iPod...
CK-12 Foundation
Multiple Bar Graphs
I scream, you scream, we all scream for ice cream bar graphs. Pupils create a multiple bar chart to represent the sales of ice cream products during the first week of summer. Using the chart, learners find the day that each of the...
College Board
Is That an Assumption or a Condition?
Don't assume your pupils understand assumptions. A teacher resource provides valuable information on inferences, assumptions, and conditions, and how scholars tend to overlook these aspects. It focuses on regression analysis, statistical...
EngageNY
Margin of Error When Estimating a Population Proportion (part 1)
Use the power of mathematics to find the number of red chips in a bag — it's a little like magic! The activity asks learners to collect data to determine the percentage of red chips in a bag. They calculate the margin of error and...
Chicago Botanic Garden
Climate Change Around the World
Look at climate change around the world using graphical representations and a hands-on learning simulation specified to particular cities around the world. Using an interactive website, young scientists follow the provided...
Curated OER
Goal Setting and Self-Assessment
Third graders review the importance of good study habits as a skill necessary for success in school. They focus on their goals and discuss how this would help to improve grades. They determine how much an F weighs their grade down.
Curated OER
Weather instruments
Students explore weather instruments. In this weather lesson, students make rain gauges, anemometers, and barometers following the instructions given in the lesson. Students set up a weather station using their instruments and record and...
CK-12 Foundation
Exponential Decay: Cool Sunglasses
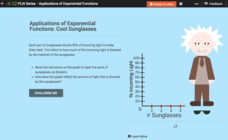
Who wouldn't want to wear four pairs of sunglasses? Each pair of sunglasses reduces the percent of incoming light by one-half. An interactive tutorial helps young mathematicians build a graph that models this scenario. They...
CK-12 Foundation
Pie Charts: Soda Party
Using the interactive, pupils create a pie chart that represents the percentage of sodas bought for a party. Individuals need to determine the percentage and number for the final variety of drinks. The learners determine how the...
Curated OER
Coral Snapshots
Using photographs and a coral reef identification key, junior marine biologists compare changes in coral cover for a No-Take Area and the surrounding unprotected area. The data that is collected is then analyzed for richness,...
Nuffield Foundation
Investigating the Effect of Concentration of Blackcurrant Squash on Osmosis in Chipped Potatoes
Model and explore osmosis using squash and potatoes. Young scientists expose chunks of potatoes to different concentrations of a squash solution. They compare the weights of the chunks before and after exposure to the solution and use...
Chymist
Ink Analysis: An Experiment in Paper Chromatography
Test differences in writing instruments with this hands-on activity to demonstrate paper chromatography in action. The class performs an experiment on multiple writing instruments and determines the area of separation to discover an...
Royal Society of Chemistry
Chemistry Masterclass—Chemistry Outreach
Immerse your chemistry class in the world of organic chemistry! Science scholars isolate acetaminophen from an over-the-counter sample during an intense and interesting lab. Groups use many different separation and analysis techniques to...
Curriculum Corner
Planning Binder
An organized classroom is a happy classroom! Keep track of all the important data for your learners with a collection of teacher templates. It includes graphic organizers for class birthdays, transportation, contact information, behavior...
Other popular searches
- Comparing Two Data Sets
- Comparing Sets of Data
- Comparing Related Data Sets
- Comparing Two Sets of Data


