Curated OER
College Prep Algebra, Worksheet Chapter 3, 2.5, 2.7, 3.1- 3.4
In this algebra worksheet, students translate 39 word problems into algebraic terms and solve them. They complete 42 problems about coordinate graphing, working with ordered pairs, slop, and equations of lines.. They make 2 scatter grams...
Modesto Junior College
Graphical Transformations of Functions
Transform your knowledge from average to excellent with this comprehensive guide to function transformations. All of the types of shifts, stretches, and reflections are included with an explanation and coordinating graph to show...
National Humanities Center
Teaching The Great Gatsby: A Common Core Close Reading Seminar
The 41 slides in a professional development seminar model how to use close reading techniques to examine the many layers of F. Scott Fitzgerald's The Great Gatsby. In addition to passages from the novel, slides provide biographical...
Curated OER
Coordinate Crunch
Students identify plots on a graph while playing a game on a large coordinate grid and then on smaller grids.
Curated OER
Graphs
In this graphs worksheet, students find the mid-point of a line and identify its coordinates. This six-page worksheet contains 7 multi-step problems. Explanations and examples are provided. Answers are located on the last page.
Curated OER
Data and Scientific Graphs
Learners conduct experiments and graph their data. In this statistics lesson, students collect data and graph it on a coordinate plane. They analyze the data looking for patterns and they discuss their findings with the class.
Curated OER
Graphing the Solution Set of a System of Inequalities
In this Algebra I/Algebra II instructional activity, students graph the solution set of a system of inequalities. The two page instructional activity contains a combination five multiple choice and free response questions. ...
Curated OER
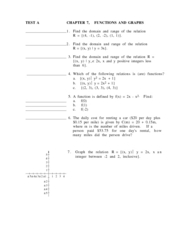
Chapter 7. Functions and Graphs
In this functions and graphs activity, students determine the domain and range of a given relation. They graph functions on a coordinate plane and write equations in the slope-intercept form. This twelve page activity...
Curated OER
Exploring Area/Perimeter Through Coordinate Geometry
Pupils explore area and perimeter through coordinate geometry using student literature, hands-on manipulatives, and the Internet.
Curated OER
Coordinates
In this coordinates worksheet, 6th graders provide the coordinates for the points on the graphs. Students complete 4 problems total on this worksheet.
Curated OER
Using Computers to Produce Spreadsheets and Bar Graphs
Students review graphing terminology and how to plot data points, how to input data into a spreadsheet, and how to make a chart using a computer.
Curated OER
Graph Paper
Students are given pre-made graph paper. In this algebra instructional activity, students are given copies of graph paper that can be used to plot points on a coordinate plane already measured out.
Noyce Foundation
Granny’s Balloon Trip
Take flight with a fun activity focused on graphing data on a coordinate plane. As learners study the data for Granny's hot-air balloon trip, including the time of day and the distance of the balloon from the ground, they practice...
EngageNY
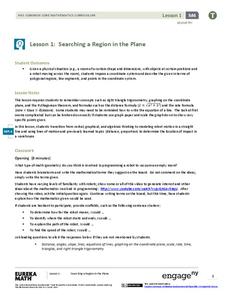
Searching a Region in the Plane
Programming a robot is a mathematical task! The activity asks learners to examine the process of programming a robot to vacuum a room. They use a coordinate plane to model the room, write equations to represent movement, determine the...
California Education Partners
Science Fair Project
Plant the data firmly on the graph. Given information about the growth rate of plants, pupils determine the heights at specific times and graph the data. Using the information, scholars determine whether a statement is true and support...
Concord Consortium
Function Project
What if a coordinate plane becomes a slope-intercept plane? What does the graph of a linear function look like? Learners explore these questions by graphing the y-intercept of a linear equation as a function of its slope. The result is a...
Curated OER
Describing Data
Your learners will practice many ways of describing data using coordinate algebra in this unit written to address many Common Core State Standards. Simple examples of different ways to organize data are shared and then practice problems...
Concord Consortium
Rational and Not So Rational Functions
Do not cross the line while graphing. Provided with several coordinate axes along with asymptotes, pupils determine two functions that will fit the given restrictions. Scholars then determine other geometrical relationships of asymptotes...
Concord Consortium
Rectangle Space
Take a coordinated look at rectangles. The task asks pupils to plot the length and width of created triangles in the coordinate plane. Using their plots, scholars respond to questions about rectangles and their associated points on the...
Concord Consortium
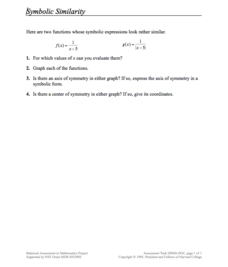
Symbolic Similarity
How many things does one transformation tell you? Learners compare and contrast the graphs of different parent functions with the same transformation. Using a rational and absolute value function, pupils identify key features of their...
Mathed Up!
Inequalities Regions
Discover how to solve systems of inequalities by graphing. An informative video shows pupils how to determine the solution set after graphing each inequality of a system. To finish, a worksheet gives them a chance to practice this skill.
EngageNY
Constant Rate
Two-variable equations can express a constant rate situation. The instructional activity presents several constant rate problems. Pupils use the stated constant rate to create a linear equation, find values in a table, and graph the...
Shodor Education Foundation
Conic Flyer
Graphing conics made easy. Individuals use an interactive to graph conic sections. The app can handle circles, vertical and horizontal parabolas, ellipses, and vertical and horizontal hyperbolas.
Other popular searches
- Blank Coordinate Graphs
- Coordinate Graphs Art
- Turkey Coordinate Graphs
- Coordinate Graphs Pictures
- Christmas Coordinate Graphs
- Coordinate Graphs of Turkeys
- Math Coordinate Graphs
- Free Blank Coordinate Graphs
- Geometry Coordinate Graphs
- Plotting Coordinate Graphs
- Coordinate Graphs Thanksgiving


