Curated OER
Osprey Journey
Students investigate the migration route of one bird, Osprey B4, using information gathered from satellites to track birds over a two-year period. They coimpare their graphs with maps of B4's migrations that have been plotted by...
Curated OER
Traveling aroud Our Town
Students are asked to describe to a partner how he or she walks to school or the bus stop. They are shown on the overhead an one-inch grid paper, and at the intersection of two lines on the grid paper, students are shown a house and...
Curated OER
Data Analysis and Measurement: Ahead, Above the Clouds
Students explore and discuss hurricanes, and examine how meteorologists, weather officers, and NASA researchers use measurement and data analysis to predict severe weather. They plot points on coordinate map, classify hurricanes...
EngageNY
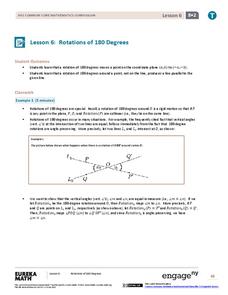
Rotations of 180 Degrees
What happens when rotating an image 180 degrees? The sixth activity in the series of 18 takes a look at this question. Learners discover the pattern associated with 180-degree rotations. They then use transparency paper to perform the...
Curated OER
What Is Your Point?
Sixth graders identify the x and y axes in a coordinate plane and identifies the coordinates of a given point in the first quadrant. They plot specific points in the first quadrant of the Cartesian coordinate system.
Curated OER
Where In the World Are We?
Fifth graders read postcards and find their locations on maps. They use the pictures and text on the postcards to write about imaginary vacations. They compute the mileage and compare it to TripMaker data.
Curated OER
Travel Time
Students use a migration map to estimate the distance traveled by a bird while migrating south. After calculating accurate estimates of the distance traveled, students compare the distances traveled with the amount of time elapsed.
Curated OER
High and Low Tides
Students collect real world data from the Web regarding high and low tides at various locations in the United States. They find a function which models this data and make predictions on tide levels based on the information found.
Curated OER
Where Did Everyone Go?
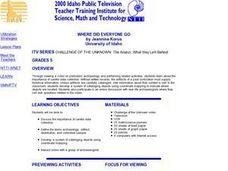
Fifth graders view a video, and perform related activities on prehistoric archaeology to gain an understanding about the importance of careful data collection. They develop a system of cataloging objects using coordinate mapping to...
Curated OER
Transformations Homework
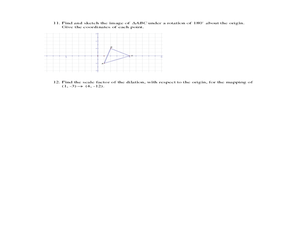
In this geometry worksheet, students transform a coordinate based on a reflection, translation, or dilation in order to obtain the image. There are 12 questions.
Curated OER
Distance Formula
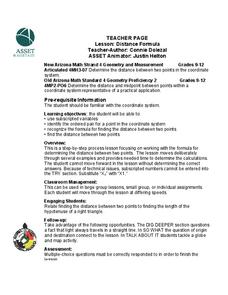
Students calculate the distance formula. In this geometry lesson, students find the distance between two points on a coordinate plane. They identify the four different quadrants.
Curated OER
Problem Solving: Graphing Functions
In this graphing functions worksheet, students solve 6 word problems, finding ordered pairs, missing coordinates and numbers, slopes of lines and functions.
Curated OER
Number lines and graphs
In this number lines and graphs worksheet, learners identify points on a number line and in a graph. Students complete 10 multiple choice questions.
Mathed Up!
Transformation of Graphs
In what ways can you transform a graph? An engaging video answers this question as it covers reflections, translations, and stretches of graphs. To test their knowledge, individuals complete a set of problems to apply this knowledge.
Noyce Foundation
Snail Pace
Slow and steady wins the race? In the assessment task, scholars calculate the rates at which different snails travel in order to find the fastest snail. Hopefully, your class will move much more quickly in finishing the task!
Curated OER
Complex Analysis: Transformations
In this transformation worksheet, students find the linear transformation of equations and use the Mobius transformation to identify image boundaries. Students describe the images in each quadrant. This two page worksheet contains six...
Curated OER
2 x 2
Students work together to grid a 2 x 2 meter unit using the formula for the Pythagorean Theorem. After creating the grid, they identify the location of artifacts and create a map of their location. They develop a graph and table of their...
Curated OER
Graphing Ordered Pairs
For this math worksheet, students learn to graph ordered pairs. Students examine a graph with 3 labeled points and tell the ordered pairs for each. Students also plot 8 ordered pairs on a graph they draw themselves.
Curated OER
Measurement and the Illampi Mound Colony
Learners comprehend the basic units of measurement, scale, plotting, and basic grids. Students practice their estimation
and measuring skills and will demonstrate their ability to work well in groups.
Curated OER
The Tale of Scale
Eighth graders, using a range of data, produce three bar graphs for various scales along the y-axis.
Curated OER
Measurement and Data Collecting using Image Processing
Students trace the route of the historical event and measure the distance over which the people involved journeyed. A data sheet be constructed outlining the location of events, and the speed with which the journey occurred.
EngageNY
Motion Along a Line – Search Robots Again
We can mathematically model the path of a robot. Learners use parametric equations to find the location of a robot at a given time. They compare the paths of multiple robots looking for parallel and perpendicular relationships and...
MARS, Shell Center, University of Nottingham
Defining Regions Using Inequalities
Your young graphers will collaboratively play their way to a better understanding of the solution set produced by the combining of inequalities. Cooperation and communication are emphasized by the teacher asking questions to guide the...
Noyce Foundation
Photographs
Scaling needs to be picture perfect. Pupils use proportional reasoning to find the missing dimension of a photo. Class members determine the sizes of paper needed for two configurations of pictures in the short assessment task.


