Curated OER
Organizing Data Using Tables and Graphs
Learners create graphs and tables, as well as interpret and make inferences from the data shown to determine when and where graphs and tables are most useful.
Curated OER
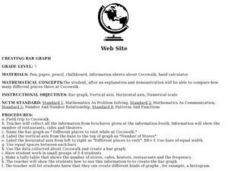
Creating Bar Graph
Seventh graders, after an explanation and demonstration compare how many different places there at Cocowalk.
Curated OER
Pizza Possibilities
Students create and interpret line plots, bar graphs, and circle graphs. The lesson assumes mastery of conversions from fraction to decimal to percent, construction of angles, and at least an introduction to graphs displaying data.
Curated OER
This is the Way We Go To School
Second graders create and utilize a graph using the Excel computer program. They gather data regarding how the students get to school, tally the numbers for the class, and create a bar graph on paper and using Excel.
Curated OER
Aerosol Lesson: Science - Graphing SAGE II Data
Students examine and plot atmospheric data on bar graphs.
Curated OER
What's Up With My Class
Learners collect data about their class and they use Excel spreadsheet to display their tables and graphs about the class. They answer survey questions and collect their data. Students create a graph of their choice to display the...
Curated OER
M&Ms Count and Crunch
Middle schoolers practice skills involving statistics and probability by making predictions on number of each color candy in one pound bag of M&Ms. They record both guesses and actual quantities, calculate percentages, and create bar...
Baylor College
Global Atmospheric Change: The Math Link
Change up the classroom atmosphere with this interdisciplinary resource. Following along with the children's book Mr. Slaptail's Curious Contraption, these math worksheets provide practice with a wide range of topics including...
CK-12 Foundation
Graphs for Discrete and for Continuous Data: Discrete vs. Continuous Data
Not all data is the same. Using the interactive, pupils compare data represented in two different ways. The learners develop an understanding of the difference between discrete and continuous data and the different ways to represent each...
CK-12 Foundation
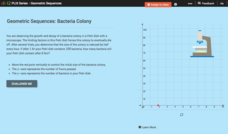
Geometric Sequences: Bacteria Colony
Show budding mathematicians how to model a diminishing bacteria colony two ways—graphically and algebraically. Using the coordinate axis, pupils create a graph to represent the decay of a bacteria colony. They determine the number of...
NFL
Super Bowl: History and Anthology
The educational opportunities are overwhelming with this (almost) complete anthology and history of every Super Bowl since 1968. Excite your football enthusiasts with information that can be used to create cross-curricular...
National Security Agency
Are You Ready to Call the Guinness Book of Records?
Learners design questions that can be answered by collecting data. In this line-plot lesson, pupils collect data and graph on a line plot on world records. An abundant supply of teacher support is provided in this resource.
Curated OER
Build a Skittles Graph
Students construct a bar graph with a given set of data. They calculate the ratio and percent of the data. Students discuss alternate ways of graphing the data as well as multiple strategies to approach the task.
Curated OER
Graphing With Paper and Computers
Fourth graders construct bar graphs. In this graphing lesson, 4th graders create bar graphs in connection with the story, The Copycat Fish. After creating the initial graphs on paper, students use MS Excel to create graphs.
Curated OER
Which Graph is best?
Students use commercial software to organize and visually display data to draw conclusions; students use graphing software to create several types of graphs illustrating the number of each color of M&M's in one bag.
Curated OER
Creating Circle Graphs using Excel
Fifth graders evaluate data from a circle graph that compares time spent on various activities. They use the computer to manipulate their own data as they compare, examine, create and evaluate data using circle graphs.
Curated OER
Creating Circle Graphs with Microsoft Excel
Students create graphs of circles. In this geometry lesson, students use Microsoft Excel to create graphs. They construct the graphs using paper and pencil as well as the computer.
Curated OER
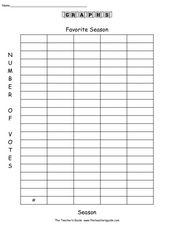
Favorite Season
In this graphing worksheet, students conduct a survey of people's favorite survey. They then complete 8 questions about the data gathered before creating a bar graph and pictograph on templates.
Curated OER
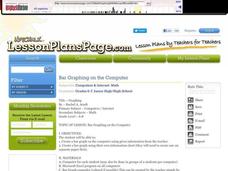
Graphing on the Computer
Middle schoolers create a bar graph on the computer using given information from the teacher. They create a bar graph using their own information chart (they need to create one on separate paper first). They utilize Microsoft Excel for...
Curated OER
Data Analysis and Probability
Students make their own puzzle grid that illustrates the number of sit-ups students in a gym class did in one minute, then they make a histogram for this same data. Then they title their graph and label the scales and axes and graph the...
Curated OER
World Oil Reserves: Assignment
Understanding and analyzing data is a critical skill. Included here are three worksheets a list of countries with the largest oil reserves, a graph of the same, and an assignment. The class uses their data to create a bar chart then...
Curated OER
Investigation - The M & M Mystery
Sixth graders inspect M&M's to complete statistical data. Students interpret percent of colors represented. They convert data from decimals, fractions, and percents. Using the data, 6th graders create a bar graph and a circle graph.
Haiku Deck
Haiku Deck - Beautiful Presentations and Slideshows with Charts and Graphs
Create beautiful and simple presentations, sales pitches, lessons, and visual stories that utilize Getty Images, high quality photos licensed under Creative Commons, as well as your own prints. What you create will demand people’s...
Curated OER
Suicides And Suicide Rates
Students investigate suicide using a variety of criteria and create a bar graph before discussing the results as a class.


