CK-12 Foundation
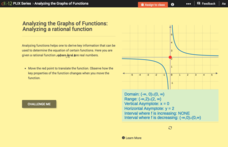
Analyzing the Graphs of Functions: Analyzing a Rational Function
Shift the function and transform the key features of the graph. By translating the graph of the rational function, class members find out how the key features alter. Pupils determine the domain, range, asymptotes, and intervals of...
Flipped Math
Calculus AB/BC - Estimating Limit Values from Graphs
A one-sided limit need not be half as interesting as a two-sided limit. Pupils learn the notation for one-sided limits and how to determine the value of a one-sided limit from graphs by watching a short video. They then see how to create...
Houghton Mifflin Harcourt
Unit 2 Math Vocabulary Cards (Grade K)
Looking for some math vocabulary cards for young mathematicians? A set of 18 vocabulary cards is a great addition to a kindergarten math lesson. The top half of each sheet contains the word in bold text, while the bottom is a...
Houghton Mifflin Harcourt
Unit 5 Math Vocabulary Cards (Grade K)
Bring a resource with 20 math vocabulary cards to a kindergarten math class. The top half of each sheet contains the word in bold text, while the bottom half is a picture representing the meaning of the word. The words on the cards...
EngageNY
Graphing the Sine and Cosine Functions
Doing is more effective than watching. Learners use spaghetti to discover the relationship between the unit circle and the graph of the sine and cosine functions. As they measure lengths on the unit circle and transfer them to a...
Curated OER
Math Can Be Electrifying
Students explore how math can be used to calculate and analyze how electricity causes air pollution. Students design a campaign to educate family members on ways they can save electricity. They create a graph that compares two electric...
Mathed Up!
Drawing Quadratic Graphs
Curve through the points. The resource, created as a review for the General Certificate of Secondary Education Math test, gives scholars the opportunity to refresh their quadratic graphing skills. Pupils fill out function tables to...
EngageNY
Graphing Solutions to Inequalities
Activate the strengths of your visual learners using an informative instructional activity. In the 15th installment of the series of 28, pupils graph their solutions on number lines to create a visual representation of solutions....
EngageNY
Equations of Graphs of Proportional Relationships Involving Fractions
The 15th segment in a series of 22 uses examples that present proportional relationships with fractions. Pupils work through the problems and discover that the process is the same as it is with whole number values. Graphing the...
Sea World
Splash of Math
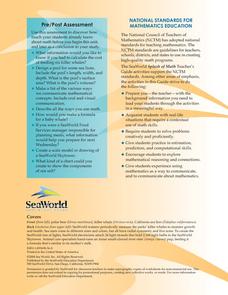
How can kids use math to learn about marine life? Combine math skills with science lessons in a resource featuring activities about life in the sea. Kids graph and calculate data, solve complex word problems, measure geometric shapes,...
Houghton Mifflin Harcourt
Unit 8 Math Vocabulary Cards (Grade 4)
Enhance fourth graders' math vocabulary with 17 word cards and their definitions. Learners focus on terms that deal with graphing, such as y-axis, coordinates, plot, and ordered pair in the last set of math vocabulary cards.
Curated OER
Building Brilliant Bar Graphs
Everything you need for a mini-unit on bar graphs is included in this lesson plan! It outlines three lessons and includes worksheets. Learners taste pretzels, shoot baskets (switching off hands), and grab candy, graphing results...
Mathematics Assessment Project
Interpreting Distance–Time Graphs
Pre-algebra protégés critique a graph depicting Tom's trip to the bus stop. They work together to match descriptive cards to distance-time graph cards and data table cards, all of which are provided for you so you can make copies for...
Curated OER
Correlation of Variables by Graphing
Middle and high schoolers use a spreadsheet to graph data. In this graphing lesson, learners determine how two parameters are correlated. They create a scatter plot graph using a computer spreadsheet.
University of North Texas
Graphing Piecewise Functions
Piecewise functions are the hodge-podge of algebra. Here, pupils watch as each graph is created and then pieced together to make a function. The first example creates a graph step-by-step, while the second problem posts a graph...
EngageNY
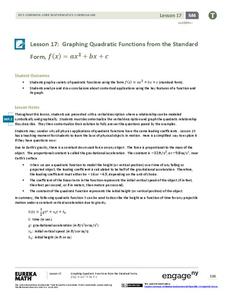
Graphing Quadratic Functions from the Standard Form
Use context to explain the importance of the key features of a graph. When context is introduced, the domain and range have meaning, which enhances understanding. Pupils use application questions to explore the key features of the graph...
EngageNY
Basic Trigonometric Identities from Graphs
Have young mathematicians create new identities! They explore the even/odd, cofunction, and periodicity identities through an analysis of tables and graph. Next, learners discover the relationships while strengthening their...
Kenan Fellows
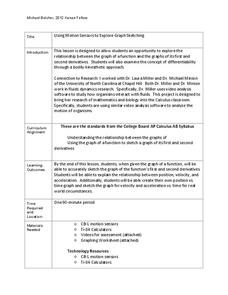
Using Motion Sensors to Explore Graph Sketching
Get moving to a better understanding of graphs of derivatives. Using motion sensors, scholars vary their velocities to create graphs of the first derivative of a function. The activity challenges groups to first create a script of the...
EngageNY
Analyzing Graphs—Water Usage During a Typical Day at School
Connect your pupils to the problem by presenting a situation with which they can identify. Individuals analyze a graph of water use at a school by reasoning and making conclusions about the day. The lesson emphasizes units and...
Illustrative Mathematics
Weather Graph Data
Teaching young mathematicians about collecting and analyzing data allows for a variety of fun and engaging activities. Here, children observe the weather every day for a month, recording their observations in the form of a bar graph....
Shodor Education Foundation
Graph Sketcher
Sketch graphs with the Graph Sketcher. Scholars graph functions on a coordinate plane. An interactive makes it as easy as inputting the function and clicking a button.
Curated OER
Graphing Data
Seventh graders solve and graph 10 different problems that include various questions related to data on a graph. First, they create bar graphs to display the data given. Then, pupils determine the random sample of a population listing...
EngageNY
Creating and Solving Quadratic Equations in One Variable
Give your classes practice at modeling using quadratic models with a resource that uses area and integer problems to allow individuals to create second degree polynomials. Young mathematicians solve equations using factoring and then...
Baylor College
Living Things and Their Needs: The Math Link
Enrich your study of living things with these cross-curricular math activities. Following along with the story Tillena Lou's Day in the Sun, learners will practice addition and subtraction, learn how to measure volume and length,...
