Curated OER
Pick A Number
Elementary schoolers find out which month has the most class birthdays (mode) and which birthday represents the middle point of all the birthdays (median). They gather and organize data to find one number that fairly represents the whole...
West Contra Costa Unified School District
Comparing Data Displays
There is so much more to data than just numbers, and this resource has learners use three methods of comparing data in a multi-faceted lesson. The 21-page packet includes a warm-up, examples, an activity, and assessment for a complete...
Curated OER
Range, Cluster, Gap and Outliers
There are a number of activities here where learners collect and record data, as well as, activities where the likelihood of an event happening is calculated given the experimental probability. Young statisticians organize information...
Curated OER
Data Clusters and Distributions
Students explore the concept of data clusters. In this survey information lesson, students watch an episode of "Cyberchase" and then discuss the pros and cons of conducting surveys and reading their results.
Curated OER
Handling Data
Students create a simple table in order to solve a problem. As a class, they create a simple data table in order to discover the number of letters in each student's name. This data is interpreted in order to answer questions and make...
Curated OER
Assessing and Investigating Population Data
Students examine population projections. In this population data lesson, students research and collect data on the population of the United States. They explore and conclude future population growth patterns. Students construct tables...
Radford University
Danger! – An Analysis of the Death Toll of Natural Disasters
Decipher the danger of natural disasters. Using researched data, scholars work in groups to create data displays on the number of deaths from different types of natural disasters. They share their graphical representations with the class...
Curated OER
Hand Span and Height
Is there a relationship between hand span width and height? Statisticians survey each other by taking measurements of both. A table that can hold data for 24 individuals is printed onto the worksheet, along with questions for analysis....
Curated OER
Data Collection
Students investigate qualitative and quantitative data. In this statistics lesson, students gather data on heights and weights of people and graph the distribution. Students discuss the differences between qualitative and quantitative data.
EngageNY
Calculating Probabilities of Events Using Two-Way Tables
Tables are useful for more than just eating. Learners use tables to organize data and calculate probabilities and conditional probabilities.
EngageNY
Estimating a Population Proportion
Find the percent of middle schoolers who want the ability to freeze time. The 21st installment in a series of 25 has groups collect a random sample of respondents who answer a question about superpowers. Using sample statistics,...
Curated OER
Flicking Football Fun
Young mathematicians fold and flick their way to a deeper understanding of statistics with a fun, hands-on math unit. Over the course of four lessons, students use paper footballs to generate data as they learn how to create line...
Radford University
A Change in the Weather
Explore the power of mathematics through this two-week statistics unit. Pupils learn about several climate-related issues and complete surveys that communicate their perceptions. They graph both univariate and bivariate data and use...
NASA
Spacewalking
Hold your breath. The video and interactive website introduce the class to spacewalking and spacesuits. Using oxygen data from two astronauts, individuals determine a mathematical model to fit the data. Using that mathematical model, the...
Radford University
Let's Buy a Car
Ready to buy a car? Learners research different makes and models of cars to decide on the best one to buy. They collect data on cost, fuel efficiency, safety ratings, and insurance costs, then create and analyze data displays to make...
Space Awareness
Coma Cluster of Galaxies
Scientists classify everything from the smallest cells to the largest galaxies, but how do they decide on a classification system? Scholars use 40 pictures of galaxies taken by the Hubble Space Telescope to sort and try creating their...
Curated OER
How Are Stars Like People?
A beautifully written lesson plan delves into a beautiful topic: stellar population. Engage aspiring astronomers with activities that examine human populations and then transition onto the stars of the universe. Data and photographs for...
Curated OER
Line Plots
In this line plot worksheet, students create a line plot of given data. They identify the range, clusters, gaps, and outliers. This one-page worksheet contains 8 multi-step problems.
Curated OER
Data Analysis Worksheet
In this probability worksheet, 11th graders solve problems using simple random sample, cluster sample, bias, population and systematic sample. They match the questions to its definition.
Curated OER
Sunspot Graphing
Students, using 15 years of sunspot data, plot data on a classroom graph. They discuss why the pattern from their individual sheets did not and could not match the class graph.
Curated OER
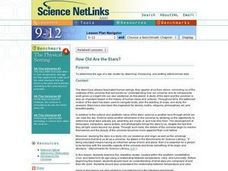
How Old Are the Stars?
Students determine the age of a star cluster by observing, measuring, and plotting astronomical data. They examine the Jewe lbox cluster, located within the southern constellation Crux and determine its age.
Fluence Learning
Writing About Literature: Exploring Themes About Conformity
Feeling the pressure to confirm is something any adolescent can relate to. Explore an essential theme with a response to literature assessment that prompts learners to identify main ideas with evidence and supporting details.
Curated OER
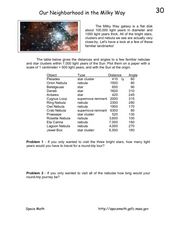
Our Neighborhood in the Milky Way
In this Milky Way galaxy worksheet, students are given a table of distances and angles of nebulae and star clusters from the sun. Students plot each one on a piece of paper and solve 2 problems using the data.
Curated OER
Application and Modeling of Standard Deviation
The first activity in this resource has learners computing the mean and standard deviation of two different data sets and drawing conclusions based on their results. The second activity has them using a dice-rolling simulation to...


