Nuffield Foundation
Investigating the Effect of Temperature on the Activity of Lipase
How does temperature affect lipase activity? Young scholars conduct an experiment to collect data on the interaction of lipase at different temperatures. They add lipase to a solution of milk, sodium carbonate, and phenolphthalein and...
Teach Engineering
Balsa Glider Competition
Change one variable and try again. Teams build basic balsa gliders and collect data on their flight distances and times. Through collaboration, the team decides on two modifications to make to the basic design and collect data for the...
Curated OER
Mighty Minerals
Students identify the characteristics of minerals. They complete proper identification tests and record the data in an organized fashion. They list important uses for minerals as well.
NASA
Tools to Study Tornadoes and Galaxies
Take your class on an intergalactic journey as they explore the galaxy and various meteorological events taking place in our atmosphere each day. Learners investigate electromagnetic waves and the Doppler Effect before gathering radar...
NASA
Connecting Models and Critical Questions
Scholars use data to analyze and determine which sets of information need to be counted. They create a model to explain differences among chemical elements using graphs to prove concept mastery.
NOAA
Importance of Deep-Sea Ecosystems – How Diverse is That?
When judging diversity of an ecosystem, both species evenness and species richness must contribute. After a discussion of diversity and a guided example using the Shannon-Weaver function, scholars use the same function on two other...
University of Georgia
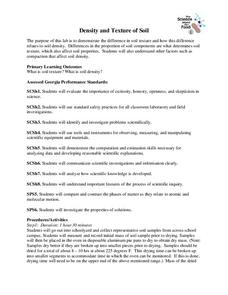
Density and Texture of Soil
All soil is not created equal! A lab activity asks learners to collect and analyze soil. Specific calculations determine the amount of sand, silt, and clay in a sample and allow individuals to identify the soil texture.
Curated OER
Hopes and Dreams: A Spreadsheet Lesson Using Excel
Fourth graders read "The Far Away Drawer" by Harriet Diller and discuss the story as a class. After discussion, 4th graders create a t-shirt GLYPH about their hopes and dreams,share their information with the class and create spreadsheets.
Curated OER
Microsoft Access Lesson Plan
Third graders read children's literature during the school year and compile a list of books and genres in an Access database. They print out a report of all the different books and genres of they read over the whole school year.
Curated OER
Learn How to Graph
Students examine various types of charts and discover how to construct a line graph. Using graph paper, they construct a graph displaying weight loss over a five-year period. They draw copnclusions from the completed graphs.
Curated OER
Graphs Abound
Students create a survey for their classmates to collect data on their favorite foods, eye color, pets or other categorical data. They compile the data from the survey in a table and then make a bar graph of each category using a web tool.
Curated OER
Awesome Animals
Young scholars collect data from classmates about their favorite animal. They use the ClarisWorks graphing program to enter data, graph results, and interpret data.
Curated OER
Statistics and Probility
Seventh graders collect data and make predictions. In this geometry lesson, 7th graders work in tiers collecting data and plotting it. They make inferences and predictions about their collected data.
Curated OER
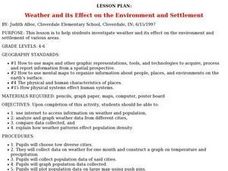
Weather and its Effect on the Environment and Settlement
Students, after choosing two diverse cities, collect data on weather for a month and construct a graph on temperature and precipitation. After collecting population data of said cities, and graphing it, they plot population on a large...
Curated OER
Graphic Favorite Breakfast Foods
Second graders graph data based on a class survey of their favorite breakfast foods. In this graphing lesson plan, 2nd graders take a class survey of their favorite breakfast foods. Then they take that data and put it into a computer...
Curated OER
Using Statistics to Uncover More Evidence
Fifth graders participate in an online Web lesson plan on ways of interpreting data. They conduct a survey and interpret the results in a journal entry.
Curated OER
Jellybean Graphs
Second graders predict and graph data based on the color of jelly beans they think are in a handful. In this prediction lesson plan, 2nd graders will predict how many of each color jellybean are in a handful. Then they graph these...
Curated OER
What's Your Favorite Season?
Students collect data on the favorite seasons. In this data collection and analysis lesson, students learn about displaying data on charts and graphs. They collect data about the favorite seasons of the children in their class and...
Curated OER
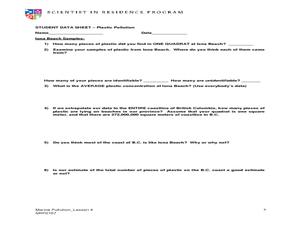
Plastic Pollution
Students determine with math concepts how much plastic pollution is affecting marine life. In this plastic pollution lesson plan, students collect scientific data from a field trip to a water treatment plant.
Curated OER
Graphs and Spreadsheets
Students collect data and present it in a graph and/or a spreadsheet, depending on their previous understanding of technology.
Curated OER
What Makes a Rocket Shoot Upward Into the Air?
Pupils collect data of balloons of different sizes to see which one travels the furthest when shot into the air to represent a rocket. In this rocket lesson plan, students write about which balloon traveled the furthest and why.
Curated OER
Climate Change
Students compare weather data and draw conclusions. For this climate change lesson plan, students determine whether data collected over a period of ninety years shows a warming trend.
Curated OER
The Air Up There
In this data collection and analysis lesson, students observe and graph the weather conditions during one school week, then calculate the average weather temperature. Extensions are included.
Curated OER
Count The Letters
Students perform activities involving ratios, proportions and percents. Given a newspaper article, groups of students count the number of letters in a given area. They use calculators and data collected to construct a pie chart and bar...
Other popular searches
- Collecting and Recording Data
- Collecting and Organizing Data
- Collecting and Graphing Data
- Collecting and Using Data
- Games on Data Collecting
- Collecting Weather Data
- Collecting and Comparing Data
- Patterns Data Collecting
- Math Data Collecting
- Patterns, Data Collecting
- Collecting and Charting Data
- Patterns\, Data Collecting


