Curated OER
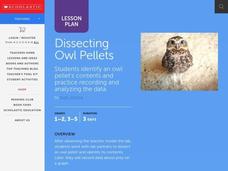
Dissecting Owl Pellets
Young scholars watch the teacher model the dissection then in pairs, they dissect an owl pellet and identify its contents. They record the data about its prey on a graph.
Curated OER
How Tolerant Are Kids in Your School?
Students graph results of a survey about attitudes and tolerance in their school. They discuss the social climate of their school. Students complete a questionnaire, and tabulate the raw data from their class. They create a bar graph...
Howard Hughes Medical Institute
Color Variation over Time in Rock Pocket Mouse Populations
A species-specific look at natural selection, the resource herein examines how adaptations have helped the population of rock pocket mice survive in a changing landscape. To begin, middle or high schoolers watch a 10.5 minute video,...
Virginia Department of Education
Electricity and Magnetism
Take charge of your class and provide them with an electrical experience! Individuals investigate the basic principles of electricity and magnetism by creating a model to test electric current and the amount of electricity generated....
Illustrative Mathematics
How Many Buttons?
Bring the class into the probability by having everyone count buttons on their shirts. Organize the data into the chart provided and chose different possibilities such as "female with one button" or "all learners with more than four...
Statistics Education Web
Odd or Even? The Addition and Complement Principles of Probability
Odd or even—fifty-fifty chance? Pupils first conduct an experiment rolling a pair of dice to generate data in a probability lesson. It goes on to introduce mutually exclusive and non-mutually exclusive events, and how to use the...
Teaching History
Jamestown: The Starving Time
High schoolers analyze a variety of primary and secondary sources to determine the cause of the Jamestown starving time during the winter of 1609–1610.
Curated OER
Gasoline Use Around the World
Students contribute their own personal gasoline consumption data with other schools. They share thoughts and opinions on fossil fuels, its effects and what they can do in an effort to conserve natural resources.
Curated OER
What's the Scoop?: Our Favourite Ice Cream Flavours
Sixth graders create a spreadsheet on the favorite ice cream flavors of their peers. They interview their classmates, documenting their findings on a "Favorite Flavors" spreadsheet. Students graph and analyze the data.
Curated OER
The Good and Bad Bacteria
Students are able to name one kind of harmful bacteria and why it hurts us and also name one kind of helpful bacteria and how we use it. They describe the process of growing bacterial cultures in a lab. Students create a reasonable...
Curated OER
Amounts of Dissolved Oxygen in Various Bodies of Water
Students test water to determine the dissolved oxygen content while displaying the proper use of testing instruments while visiting water testing sites. They determine if the amount of dissolved oxygen is appropriate for the tested...
Curated OER
Trash to Gas
Middle schoolers experiment with biomass materials as alternative energy sources. In this biomass material lesson, students participate in an experiment with cow manure to determine how it can be used as an energy source. They record...
Michigan State University
Bug Lyphe!
Introduce ecology classes to biodiversity and interdependence in ecosystems with a PowerPoint presentation. Then, they get up-close and personal with the invertebrate world by collecting insects, classifying them, and graphing their...
Museum of Tolerance
Where Do Our Families Come From?
After a grand conversation about immigration to the United States, scholars interview a family member to learn about their journey to America. They then take their new-found knowledge and apply their findings to tracking their family...
Kenan Fellows
Using Water Chemistry as an Indicator of Stream Health
Will this water source support life? Small groups test the chemistry of the water drawn from two different sources. They then compare the collected data to acceptable levels to draw conclusions about the health of the source. The...
Smithsonian Institution
Trait Tracker
Help mice beat the odds with an exciting activity about traits. Biologists discover the role of diet and other factors on animal traits by participating in a simulation activity. Teams collect and evaluate data to understand how certain...
Nature Works Everywhere
Sharks and Shorelines
Examine predator-prey marine relationships through an interactive lesson design. Learners begin by studying a specific shark species and then analyze real-time shark-tracking data. They also study threats to shark populations and...
Curated OER
Real Estate Lesson: Monthly Payments
Students examine real-world data relating to real estate. They conduct Internet research, record data regarding real estate in major cities, graph the data, calculate mortgage payments using a mortgage calculator, and analyze the data.
Curated OER
Gingerbread Man Math
Students collect and explore gingerbread man data. In this math and technology lesson plan, students examine how to organize and interpret data in three formats: objects, pictures, and graphs.
Curated OER
Education for Global Peace
Fifth graders construct data graphs based upon sets of data. In this graphing lesson, 5th graders read the text If the World Were a Village and discuss how types of graphs accurately represent a large population. Students construct their...
Curated OER
Show Me!
Students analyze and interpret graphs. In this graphing lesson, students view a video and construct their own graphs (line, circle, bar) from given sets of data.
Curated OER
"Colors" a poem by Shel Silverstein
Students collect data, graph it, and use the data to find measures of central tendencies, and find probabilities.
Curated OER
Ice Melting Investigation
Young scholars conduct an ice melting investigation in which they observe and measure the melting of two ice spheres. They develop a hypothesis as to which sphere will melt the fastest, collect data every ten minutes, and graph the data...
Curated OER
Mystery Graphs
Learners study graphs and learn how to display information into a graph. In this graph lesson plan, students construct a graph of their own sorted data, and pick out things in graphs that are inconsistent.
Other popular searches
- Collecting and Recording Data
- Collecting and Organizing Data
- Collecting and Graphing Data
- Collecting and Using Data
- Games on Data Collecting
- Collecting Weather Data
- Collecting and Comparing Data
- Patterns Data Collecting
- Math Data Collecting
- Patterns, Data Collecting
- Collecting and Charting Data
- Patterns\, Data Collecting


