Fort Bend Independent School District
Data Analysis - AP Statistics
What better way to study survey design than to design your own survey! Bring a versatile data analysis project to your AP Statistics class, and encourage them to apply the practices from their instructions to a real-world survey...
Illustrative Mathematics
Weather Graph Data
Teaching young mathematicians about collecting and analyzing data allows for a variety of fun and engaging activities. Here, children observe the weather every day for a month, recording their observations in the form of a bar graph....
American Museum of Natural History
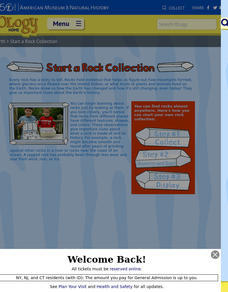
Start a Rock Collection
Rocks hold evidence of Earth's past. A three-step guide describes the process of creating a rock collection. It provides a data collection sheet to make notes about each sample.
Houston Area Calculus Teachers
Collecting Driving Data
Give AP Calculus classes the opportunity to check the accuracy of their calculations! A calculus activity involves the collection of data, the application of mathematics, and the analysis of the accuracy of results. Young mathematicians...
Curated OER
A Research Project and Article For the Natural Inquirer
Get your class to use the scientific process to solve a scientific problem. They utilize the Natural Inquirer magazine to identify a research question which they write an introduction to and collect data to answer. They use graphs,...
NASA
How to Do a Science Fair Project
Build problem-solving skills with science! Step-by-step videos walk investigators through each stage of completing a science fair project. Scientists learn to formulate a testable question, design an experiment, collect data, draw...
Chemical Education Foundation
Teacher's Guide to Science Projects
Do you find the idea of having a science fair with all of your students intimidating? Use a guide that provides everything you need to know to make project-based learning manageable. The resource includes options for four...
US Department of Agriculture
Sink or Float?
Will it sink or will it float? Learners predict the outcome as they drop random objects into a container of water. Then, they keep track of the results and record the data in a t-chart to draw a final conclusion.
NASA
Erosion and Landslides
A professional-quality PowerPoint, which includes links to footage of actual landslides in action, opens this moving instructional activity. Viewers learn what conditions lead to erosion and land giving way. They simulate landslides with...
Curated OER
Tech Integration Project Lesson Accelerator: Project Overview
Prepare middle schoolers for life in the tech world with a lesson on entering, storing, sorting, and creating database collections. They use a database tool, such as excel, to record the contents of their CD collections. They then...
PBL Pathways
Medical Insurance 2
Make an informed decision when choosing a medical insurance provider. An engaging lesson asks your classes to write piecewise models to represent the cost of different medical plans. The project-based learning activity is a variation of...
Houston Area Calculus Teachers
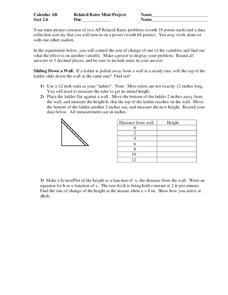
Related Rates
Use a hands-on approach to exploring the concepts of related rates in your AP Calculus class. Individuals explore the effect of the rate of change on a variable related to a variable they control. After analyzing the data they...
Teach Engineering
Where Are the Plastics Near Me? (Mapping the Data)
The last activity in a nine-part series has teams create a Google Earth map using the data they collected during a field trip. Using the map, groups analyze the results and make adjustments to the map to reflect their analysis. A short...
Howard Hughes Medical Institute
Human Impacts on Biodiversity
Have you always wanted to take your science class on an amazing field trip they will never forget? Now you can! Observe the wildlife in an African savanna through trail cameras with a five-part data analysis activity. Learners analyze...
Teach Engineering
Energy on a Roller Coaster
Roll with your class into the idea of conservation of energy. Pupils use a roller coaster track to collect data to reinforce the concept of conservation of energy and the influence of friction. Class members then create a graph from...
Sharp School
Newton’s Laws of Motion Project
After a review of all three of Newton's laws, physical scientists complete a choice project. They can create a book in which they collect pictures where the laws of motion are depicted, produce a PowerPoint presentation, or produce a...
Consortium for Ocean Leadership
Nannofossils Reveal Seafloor Spreading Truth
Spread the word about seafloor spreading! Junior geologists prove Albert Wegener right in an activity that combines data analysis and deep ocean exploration. Learners analyze and graph fossil sample data taken from sites along the...
PBL Pathways
Medical Insurance 3
Create a technical report explaining the components of a medical plan through a function. The project-based learning activity gives a medical insurance scenario that young mathematicians model using piecewise functions. Their analyses...
PBL Pathways
Medical Insurance
Design a plan for finding the best health insurance for your money. Learners compare two health plans by writing and graphing piecewise functions representing the plan rules. Using Excel software, they create a technical report...
PBS
Plants Count
Changes to habitats mean changes to resources. Groups examine aerial maps to predict areas of low and high plant resources. After formulating a plan, they visit the areas to collect data about the plant resources and then share their...
Curated OER
The Upper Palouse Restoration Project
Students become competent, to collect, record, and interpret information about a particular project they are undertaking. They apply the data and interpret them to analyze the environmental impact of a restoration project.
Worchester Polytechnic Institute
Interactive Laboratory Activities for Secondary Education
Do you think the lab smells like rotten eggs? Sorry to hear about your sulfering. A set of five experiments covers many different topics including seasons, gravity, food, precipitation, and photosynthesis. Though not presented as a...
Teach Engineering
What's Wrong with the Coordinates at the North Pole?
Here is an activity that merges technology with life skills as individuals use Google Earth to explore the differences between coordinate systems and map projections. The self-guided worksheet is the fourth segment in a nine-part unit....
Curated OER
Mathemafish Population
It's shark week! In this problem, young mathematically minded marine biologists need to study the fish population by analyzing data over time. The emphasis is on understanding the average rate of change of the population and drawing...


