Curated OER
Interpreting Data-Working with Controls and Variables
Students review the meaning of control and variables, and state difference between dependent and independent variables. They complete a worksheet with the definitions and complete problems that show their understanding.
Curated OER
Integrating Physics-Observing and Experimenting to Find Relationships
In this experimental relationship worksheet, students read about direct and indirect relationships between variables in experiments. They answer three questions about relationships between variables.
Curated OER
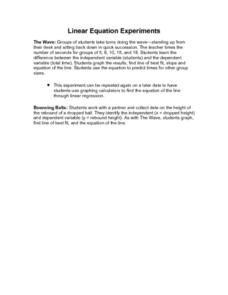
Linear Equation Experiments
For this linear equation worksheet, students solve and complete 2 different experiments that include using linear equations. First, they determine the difference between independent and dependent variables. Then, students graph their...
Balanced Assessment
Function or Not?
Is it possible for an equation to be a function and not a function at the same time? By completing a short assessment, young mathematicians answer this question. Class members provide an explanation on how an equation represents a...
Shodor Education Foundation
Scatter Plot
What is the relationship between two variables? Groups work together to gather data on arm spans and height. Using the interactive, learners plot the bivariate data, labeling the axes and the graph. The resource allows scholars to create...
Teach Engineering
Exploring Variables While Testing and Improving Mint-Mobiles (for High School)
Mint candies are good for more than just one's breath. Using basic materials such as mint candies, straws, index cards, and Popsicle sticks, scholars create race cars that meet a given budget as well as design constraints. They perform...
Flipped Math
Create and Analyze Graphs
Model the world with graphs. Pupils watch and participate in creating graphs to model real-world situations. The presenters stress the importance of a consistent scale and proper labels for the graphs along with identification of the...
CPO Science
Science Worksheets
If you need an array of worksheets to augment your science lessons, peruse a collection of assignments that is sure to fit your needs. With topics such as metric conversion, the scientific method, textbook features, research skills,...
Curated OER
Fast Talker - Ch 2 project
Tongue Twisters?! Create scatter plot graphs based on timing fellow classmates saying tongue twisters. Then investigate, display, and analyze the relationships based on functions. Wrap up this activity by making a poster or other...
Curated OER
Experimental Design Practice
In this experimental design worksheet, students are given two experimental scenarios to read. They answer questions about each including finding the hypothesis, the independent and dependent variables and controls. They design a graph...
Curated OER
Bellwork for Week 2-Experimental Design and Measurements
In this experimental design and measurement worksheet, students answer questions about independent and dependent variables, they write hypotheses, they identify instruments that measure mass, weight, and volume and they calculate the...
Curated OER
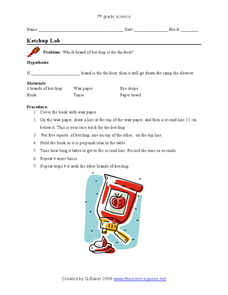
Ketchup Lab
In this ketchup worksheet, students investigate the thickness of different types of ketchup. They hypothesize, identify their independent and dependent variables, test their hypothesis and write conclusions based on their data.
Curated OER
Scientific Method Study Guide
In this scientific method worksheet, students answer questions about the various steps of the scientific method. They distinguish between the variables in an experiment and between a hypothesis and a theory.
Curated OER
What's Your Shoe Size? Linear Regression with MS Excel
Learners collect and analyze data. For this statistics lesson, pupils create a liner model of their data and analyze it using central tendencies. They find the linear regression using a spreadsheet.
Curated OER
Series Solution of the Time-Independent Schrödinger Equation
In this math worksheet, students find the solutions to the problems that apply the time-independent Schrödinger equation. They examine the relationship between the mass and energy.
Curated OER
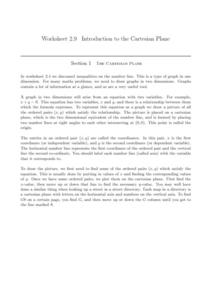
The Cartesian Plane
Learners solve and complete 22 various types of problems. First, they find the gradients of the lines and plot the given points. Then, they complete the table of values for each equation and use the table to draw the graph.
CCSS Math Activities
Smarter Balanced Sample Items: 6th Grade Math – Target G
Making money and saving money turn into high interest topics for sixth graders. Grade 6 Claim 1 Item Slide Shows use these topics in a presentation with math practice problems. The questions require applying knowledge of algebraic...
Curated OER
The Slope of a Line
In this slope instructional activity, students examine graph and determine the slope of a line. They determine coordinates of a point to make a true statement. Students identify the dependent variable and the independent variable. ...
EngageNY
Problems in Mathematical Terms
Whether scholars understand independent and dependent variables depends on you. The 32nd installment of a 36-part series has learners analyze relationships in real-world problems through tables. They determine independent and dependent...
EngageNY
Multi-Step Problems in the Real World
Connect graphs, equations, and tables for real-world problems. Young mathematicians analyze relationships to identify independent and dependent variables. These identifications help create tables and graphs for each situation.
Virginia Department of Education
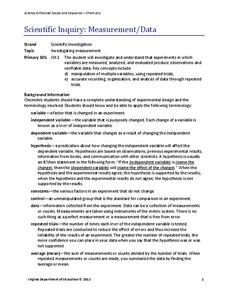
Scientific Inquiry: Measurement/Data
While pupils design their own lab experiments, they will not form a new species. Scholars take their materials and design an experiment regarding reaction rates.
Curated OER
Popcorn Science
Students identify and apply the scientific method through an experiment with popcorn. Then they identify what independent, dependent, and control variables are and create a list of different variables that affect popcorn popping....
NASA
Exercising in Space
Using the CEVIS space bike as a context, groups work together to calculate the settings required for astronauts to reach their necessary exercise. Pupils calculate the prescribed exercise settings and complete the last section, which can...
Shodor Education Foundation
Incline
Study velocity while examining graphical representations. As scholars work with the animation, they discover the effect the height of an incline has on the velocity of the biker. They make conclusions about the slope of the line in terms...


