CK-12 Foundation
Free Body Simulation
To show the magnitude and direction of all forces acting upon an object, scientists use a free body diagram. This simulation serves as an introduction to free body diagrams allowing scholars to build their own. Pupils select the proper...
Curated OER
Comparing Cinderella and The Rough-Face Girl
Pupils examine similarities and differences between cultures. They'll see that literature, reading, and story telling is something all cultures have in common. They should construct Venn diagrams to help them compare and contrast the...
Curated OER
Unit VIII Worksheet 5: Circular Motion
Seven problems send physics stars out of this world! Challenge learners to calculate centripetal force, time to complete revolutions, circular speed, and acceleration. They also are asked to explain scenarios and draw a force diagram for...
Curated OER
Learning From the Past
Coming up on the Olympics? Be sure your middle schoolers understand the dynamic and ancient history of this global tradition. They begin by recalling traditions parents have passed down, considering their relevance and ways they might be...
Curated OER
Comparing Visual Interpretations and Actual Events: War & Battle
A Venn Diagram is used to compare artistic and historical representations of a single event. Young analysts view the provided images, read textbook descriptions, and discuss the validity of each representation in terms of bias and...
Curated OER
Oklahoma! The Cultural Myth of America
Learners explore cultural myths in America by collecting images and characteristics of stereotypical Americans. They read a primary source document, discussing the views of the author in class. Next, they compare the terms used to...
Curated OER
Integrated Algebra Regents Questions: Combinations and Probability
For this combinations and probability worksheet, students solve 3 short answer problems. Students draw tree diagrams to represent possible outcomes in a sample space. Students determine the probability of an event.
University of Texas
Free-Body Diagram
Preparing for an AP test is about more than bubble sheets and memorization. The two activities in this resource require a direct application of skills learned throughout an AP Physics course.
Jordan-Granite Consortium
Scatter Diagram
You aced the first test, so your score on the second one shouldn't matter, right? Young pupils first draw a best fit line on a provided scatter plot showing test scores for two different tests. They then evaluate five statements on the...
Royal Society of Chemistry
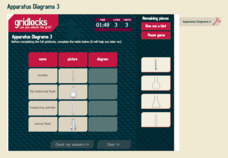
Apparatus Diagrams 3
Glassware everywhere! How do you help scholars learn to identify the different types of laboratory glassware? Introduce them to some of the main tools of the trade through interactive puzzles. Users match and manipulate items based on...
Curated OER
Two Settings
Learners respond to the text Riding Freedom. They will compare and contrast two settings by filling in a graphic organizer. They explore different settings, discuss the reasons why settings change, and draw conclusions using descriptive...
Royal Society of Chemistry
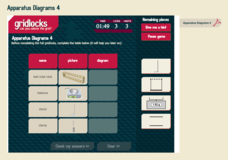
Apparatus Diagrams 4
Lab tools are cool! But, which one is the right tool for the job? Young scientists participate in a series of puzzles focused around some common lab equipment. Each puzzle requires learners to associate the tool with its image and a...
Curated OER
Naming Quadrilaterals
Scholars examine six common quadrilaterals and identify each by writing its name beneath the shape. Next, they sketch four shapes: parallelogram, rectangle, rhombus, and trapezoid. Once finished, review which features helped learners...
Curated OER
Bohr Energy Level Diagrams for Atoms
In this Bohr model worksheet, students draw 16 diagrams given atoms in the periodic table and must show the energy level diagrams indicating the electrons in each energy level.
Curated OER
Tile Diagrams
In this tile diagrams worksheet, 8th graders solve and complete 12 different problems that include using cups and tiles to solve each equation listed. First, they show the check process for each problem by substituting their answer for...
Curated OER
Marking Time
Two narrative excerpts tell the same story from different points of view. In the first excerpt (first person), sequencing words and phrases are bolded and learners write down what the bold type does. The second excerpt is in third...
Curated OER
Presentation of Quantitative Data- Vertical Line Diagrams
In this quantitative data worksheet, students examine how vertical line diagrams can be used to display discrete quantitative data. They read about the use of tally charts to create vertical line graphs that display the data. They...
Curated OER
Seeing in 3D: Interpreting Two-Dimensional Diagrams of Three-Dimensional Objects
Students hone in on their skills at reading diagrams. In this dimensional lesson students collect information on the functions of organs then figure out how all the parts work together.
Curated OER
Metals vs. Non-Metals: Dot Diagrams; Ions
In this metals, non-metals, dot diagrams and ions activity, learners read about each of these topics and they identify if 8 elements are metals or non-metals, they draw electron dot diagrams for 5 elements, they write the charge of 3...
CCSS Math Activities
Scatter Diagram
Don't let a great resource scatter to the winds. Pupils analyze two sets of test scores on a scatter plot. They draw a line of best fit and use it to make predictions about the test scores. They also consider any apparent trends in the...
Illustrative Mathematics
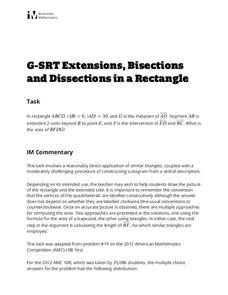
Extensions, Bisections and Dissections in a Rectangle
Gaining practice in translating a verbal description into a diagram and then an equation is the real point of this similar triangles exercise. Once the diagram is drawn, multiple methods are provided to reach the conclusion. An effective...
Illustrative Mathematics
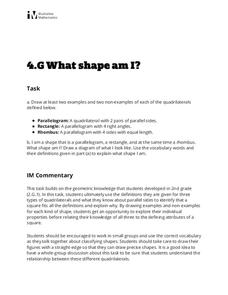
What Shape Am I?
Sharpen your pencil and grab a ruler, it's time to draw some quadrilaterals! Given the definition of a parallelogram, rectangle, and rhombus, learners draw examples and nonexamples of each figure. The three definitions are then used to...
Noyce Foundation
Which is Bigger?
To take the longest path, go around—or was that go over? Class members measure scale drawings of a cylindrical vase to find the height and diameter. They calculate the actual height and circumference and determine which is larger.
Exploratorium
Measuring and Mapping the Playground
The school playground is a great place to learn about math. Pupils measure the dimensions of a playground using baby steps and individual strides. They use their measurements to create a scale drawing of the playground by applying an...


