Curated OER
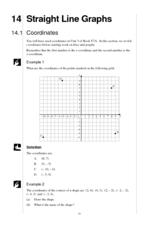
Algebra: Coordinates and Straight Line Graphs
Young mathematicians review what they have previously learned about coordinates and straight line graphs. Then, they access an interactive component within the lesson to gain more practice with this skill. Additionally, there are two...
Curated OER
Straight Line Graphs
Students discover certain equations produce straight lines. In this graphing instructional activity, students draw axis and problem solve to find coordinates to graph.
EngageNY
Informally Fitting a Line
Discover how trend lines can be useful in understanding relationships between variables with a lesson that covers how to informally fit a trend line to model a relationship given in a scatter plot. Scholars use the trend line to make...
American Statistical Association
You and Michael
Investigate the relationship between height and arm span. Young statisticians measure the heights and arm spans of each class member and create a scatter plot using the data. They draw a line of best fit and use its slope to explain the...
West Contra Costa Unified School District
Correlation and Line of Best Fit
Computers are useful for more than just surfing the Internet. Pupils first investigate scatter plots and estimate correlation coefficients. Next, they use Microsoft Excel to create scatter plots and determine correlation coefficients and...
Curated OER
Animal Brains
Do big bodies make big brains? Let your learners decide whether there is an association between body weight and brain weight by putting the data from different animals into a scatterplot. They can remove any outliers and then make a line...
Curated OER
Comparing Data on Graph A and Graph B
Second graders gather and graph data. In this graphing lesson, 2nd graders collect data and graph this information using tally charts, bar graphs, pictographs, or tables. They make predictions about the outcomes.
Curated OER
Graphing Equivalent Fractions
Students graph families of equivalent fractions and compare them by observing the slope of the line formed by each fraction family. They place fractions in ascending order by comparing the slopes of each line after several families of...
Virginia Department of Education
May I Have Fries with That?
Not all pie graphs are about pies. The class conducts a survey on favorite fast food categories in a lesson plan on data representation. Pupils use the results to create a circle graph.
Curated OER
Constructing Parallel Lines
Students construct parallel lines using a protractor and a straightedge. In this geometry lesson, students identify the properties of parallel lines. They use Cabri to graph and observe the lines.
Curated OER
Straight Graph Lines: Coordinates
Young scholars access prior knowledge of coordinates. In this coordinates lesson, students graph coordinate points to create a symmetrical figure and of a straight line. Young scholars complete several practice examples.
Curated OER
Parabolas
Students investigate parabolas and their equations. In this parabolas and their equations lesson, students graph quadratic equations on their graphing calculator. Students find the axis of symmetry of a parabola. Students discuss the...
Curated OER
Graphing Integers
Fifth graders complete an integer graphing activity. In this integer graphing instructional activity, 5th graders use coordinate grids to help them complete linear functions and integer graphing.
Code.org
Sending Numbers
Binary graphing ... bit by bit. Pairs work together to develop a protocol in order to send the points of a graph. One partner sends the points and the other receives them and tries to recreate the graph. The pupils use the rubric to...
Georgia Department of Education
Math Class
Young analysts use real (provided) data from a class's test scores to practice using statistical tools. Not only do learners calculate measures of center and spread (including mean, median, deviation, and IQ range), but also use this...
Curated OER
Graphing Coordinates
Sixth graders practice graphing coordinates. In this geometry lesson, they use the x and y axis to locate points that must be connected in the right sequence to form a straight line.
Curated OER
Symmetrical Designs with Pretzels and Marshmallows
Fifth graders create designs that have lines of symmetry using pretzel and marshmallows. In this symmetry design instructional activity, 5th graders work in groups using graph paper, rulers, and toothpicks to plan their own lines of...
Curated OER
A Real Life Example of the Distance Formula
Students answer the following question: "Using the lines of latitude and longitude, what is the distance (in degrees) if you were to travel from NASA Dryden to NASA Ames?" They use the distance formula to find the distance (measured in...
Curated OER
Map Your School
Learners participate in a project to map their school. They measure and graph various areas around the school. Students find the longitude and latitude of the school and research the school's history, and highlight special important areas.
Curated OER
Shortest Distance Between Points and Lines
Learners use technology to determine the shortest between two points in a plane. They are required to support their analytic explanations with visual illustrations.
Curated OER
Exploring Geometric Patterns and Relationships
Sixth graders explore different geographic relationships in like drawing lines, rays, and parallelograms. This lesson could be used for review because it covers more than one concept. The students should have prior knowledge.
Illustrative Mathematics
Half of a Recipe
Kids love to cook! What is a better place to learn mixed numbers than with a recipe? It is up to learners to decide how they want to divide this recipe in half. They may choose to model the mixed number and then divide the model by two....
Curated OER
Worksheet 15-Fall 1995
For this math worksheet students use the intermediate value theorem to solve two problems. They find parallel lines that will cut a convex shape into two pieces with equal areas. Students repeat this problem with a concave shape....
Curated OER
Mathematics of Doodles
Students use the slope and y-intercept to graph lines. For this algebra lesson, students graph linear equations and apply it to solving real life problems.


