Curated OER
Things Fall Apart: Bloom's Taxonomy of Thinking Processes
One of the things that makes Bloom's Taxonomy so effective is that it works off different levels of understanding. Test your readers' knowledge, comprehension, application, analysis, synthesis, and evaluation with these short questions....
Rivanna Regional Stormwater Education Partnership
Does It Soak Right In?
Which materials are best for groundwater runoff, and which are best for percolation? Discuss the water table with several experiments about different types of soil, pollution, precipitation, and filtration. The experiments assign roles...
Rivanna Regional Stormwater Education Partnership
Invisible Passengers
How does water pollution affect the organisms living in the water? Use three science experiments to examine how erosion and other pollutants can affect water quality. Each experiment focuses on a different aspect of pollution and...
Illustrative Mathematics
Miles to Kilometers
Can your mathematicians come up with an easy way to convert miles to kilometers? Start by asking learners to write an algebraic expression for each of the descriptions given. Once they determine that they are both the same, ask...
Sierra College
"Deals on Wheels!" Car Loan Project
Help your class members learn how to use their income wisely with a comprehensive lesson plan on calculating monthly car payments. Using basic math skills and online calculators, your learners will determine the total amount to be...
Curriculum Corner
8th Grade Math "I Can" Statement Posters
Clarify the Common Core standards for your eighth grade mathematicians with this series of classroom displays. By rewriting each standard as an achievable "I can" statement, these posters give students clear goals to work toward...
Illustrative Mathematics
Seven Circles III
A basic set-up leads to a surprisingly complex analysis in this variation on the question of surrounding a central circle with a ring of touching circles. Useful for putting trigonometric functions in a physical context, as well as...
Novelinks
The Little Prince: Blooms’ Taxonomy Questions
Question what you read with a lesson based on Bloom's Taxonomy. As kids read The Little Prince by Antoine de Saint-Exupéry, they formulate questions with cues from a graphic organizer, and answer them to work on critical thinking skills.
EngageNY
Graphs of Piecewise Linear Functions
Everybody loves video day! Grab your class's attention with this well-designed and engaging resource about graphing. The video introduces a scenario that will be graphed with a piecewise function, then makes a connection to domain...
Charleston School District
Pre-Test Unit 1: Exponents
How much do you know about exponents? The pre-test covers the concepts of integer exponents with both numerical and algebraic one-variable expressions. The test is also over representing numbers in scientific notation, operating with...
Balanced Assessment
Confetti Crush
In the first part of a middle school assessment task, learners analyze a given statement about the amount of confetti revelers throw at Times Square on New Year's Eve. The second part of the task requires learners to identify objects...
Rainforest Alliance
Forests of Guatemala
With 90 percent of its land area covered in forests, Suriname, a country in South America, contains the largest percentage of forests throughout the world. Here is an activity that brings classmates together to learn about the...
Statistics Education Web
Text Messaging is Time Consuming! What Gives?
The more you text, the less you study. Have classes test this hypothesis or another question related to text messages. Using real data, learners use technology to create a scatter plot and calculate a regression line. They create a dot...
Statistics Education Web
Types of Average Sampling: "Household Words" to Dwell On
Show your classes how different means can represent the same data. Individuals collect household size data and calculate the mean. Pupils learn how handling of the data influences the value of the mean.
Inside Mathematics
Scatter Diagram
It is positive that how one performs on the first test relates to their performance on the second test. The three-question assessment has class members read and analyze a scatter plot of test scores. They must determine whether...
NOAA
Biological Oceanographic Investigations – Signals from the Deep
The Deepwater Horizon oil spill directly impacted an area of the Gulf of Mexico the size of Oklahoma. A marine biology lesson plan looks at the impact of an oil spill on the deeper parts of the ocean. Scholars download actual data...
Inside Mathematics
Winning Spinners
Winning a spin game is random chance, right? Pupils create a table to determine the sample space of spinning two spinners. Individuals determine the probability of winning a game and then modify the spinners to increase the probability...
Illustrative Mathematics
Modeling London's Population
Looking at London's population from 1801–1961 in 20 year increments, high school mathematicians determine if the data can be modeled by a given logistic growth equation. They explain their thinking and determine the values of each...
EngageNY
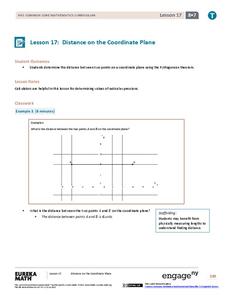
Distance on the Coordinate Plane
Apply the Pythagorean Theorem to coordinate geometry. Learners find the distance between two points on a coordinate plane by using the Pythagorean Theorem. The vertical and horizontal change creates a right triangle, which allows...
Virginia Department of Education
Arc Length and Area of a Sector
What do skateboarding and baked goods have in common with math? You can use them to connect half-pipe ramps and cakes to arcs and sectors. Pupils compare the lengths of three different ramp options of a skate park. They calculate the...
NASA
What's the Frequency, Roy G. Biv?
While all light travels at the same speed, each color in the visible light spectrum contains a different wavelength and frequency. Scholars determine the relationship between frequency and wavelength as they complete the activity. They...
National Nanotechnology Infrastructure Network
Synthesis and Characterization of CdSe Quantum Dots
Does the size of a sample change the physical properties of that substance? It turns out it can! Young scientists combine physics and chemistry to synthesize CdSe quantum dots and record their color properties. Learners should notice a...
Mathematics Vision Project
Module 8: Probability
It's probably a good idea to use the unit. Young mathematicians learn about conditional probability using Venn diagrams, tree diagrams, and two-way tables. They also take into consideration independence and the addition rules.
Council for Economic Education
Unemployment Data: Is the Economy Healthy?
The United States will never see a time when the unemployment rate hits 0%. Why? Scholars research economic data to uncover clues hidden in the unemployment rate at any given time. A short video as well as research activities help...


